MINE THE GAP (cognitive therapy for basin modellers)
Loftus, GWF. Nourse, RP. and Bond, MA
30th November, 2021

We scarcely need reminding that exploring for oil and gas is fundamentally an evidence-based science. Basin modellers create models that convolve data and geological learning to make predictions about the presence/absence, and the nature of petroleum systems. We demand a great deal from basin models to predict what a petroleum system is capable of delivering (its endowment potential), whilst also revealing some of the main levers to polarise risk, which in turn supports decision makers to drive data acquisition to further reduce risk. But it is often uncertainty that drives basin modelling, which is there because, for all the evidence, there are gaps in our knowledge as there are gaps in our perceptions. The complexity is compounded by the fact that all basins are unique, which means that any basin model will always be wrong because (amongst other things) we can’t accurately characterise what we don’t know. Uniqueness is the enemy of predictability, so we have to consciously build compromise into models (normally around resolution), in the hope of capturing a plausible range of what we know we don’t know. The greater the uncertainty, the larger the content of the basin model that is strongly influenced by the content knowledge (the experience) of the basin modeller.
We pride ourselves on our objectivity when it comes to prediction. Unfortunately, what we do know is more influential than what we don’t know and that, in itself, is a form of bias, which can lead to overconfidence. In effect, we use the models to convince ourselves of the predictability of events, which are in fact unpredictable, implicitly denying the reality of uncertainty. That doesn’t invalidate the model but it should make us wary of the influence that our motives may have exerted in making the model.
A live data-room simulation of a hybrid frontier opportunity was conducted at the Geological Society, which revealed two different modes of thinking. Firstly, participants were asked to self-report their opinion on the prospectivity of the opportunity; their intuitive gut-feel on a scale of 1-5. The simulation secondly deconstructed each opinion by examining what the data were actually telling them about the opportunity as individuals, expressed on the same scale of relative attractiveness for the opportunity. By comparing participants’ opinions with what the data were actually telling them, a measurable internal conflict (aperceptual gap) emerged, revealing a clear swing from positive to negative with increasing experience, which the authors argue is both measurable and essential in support of decision making.
INTRODUCTION
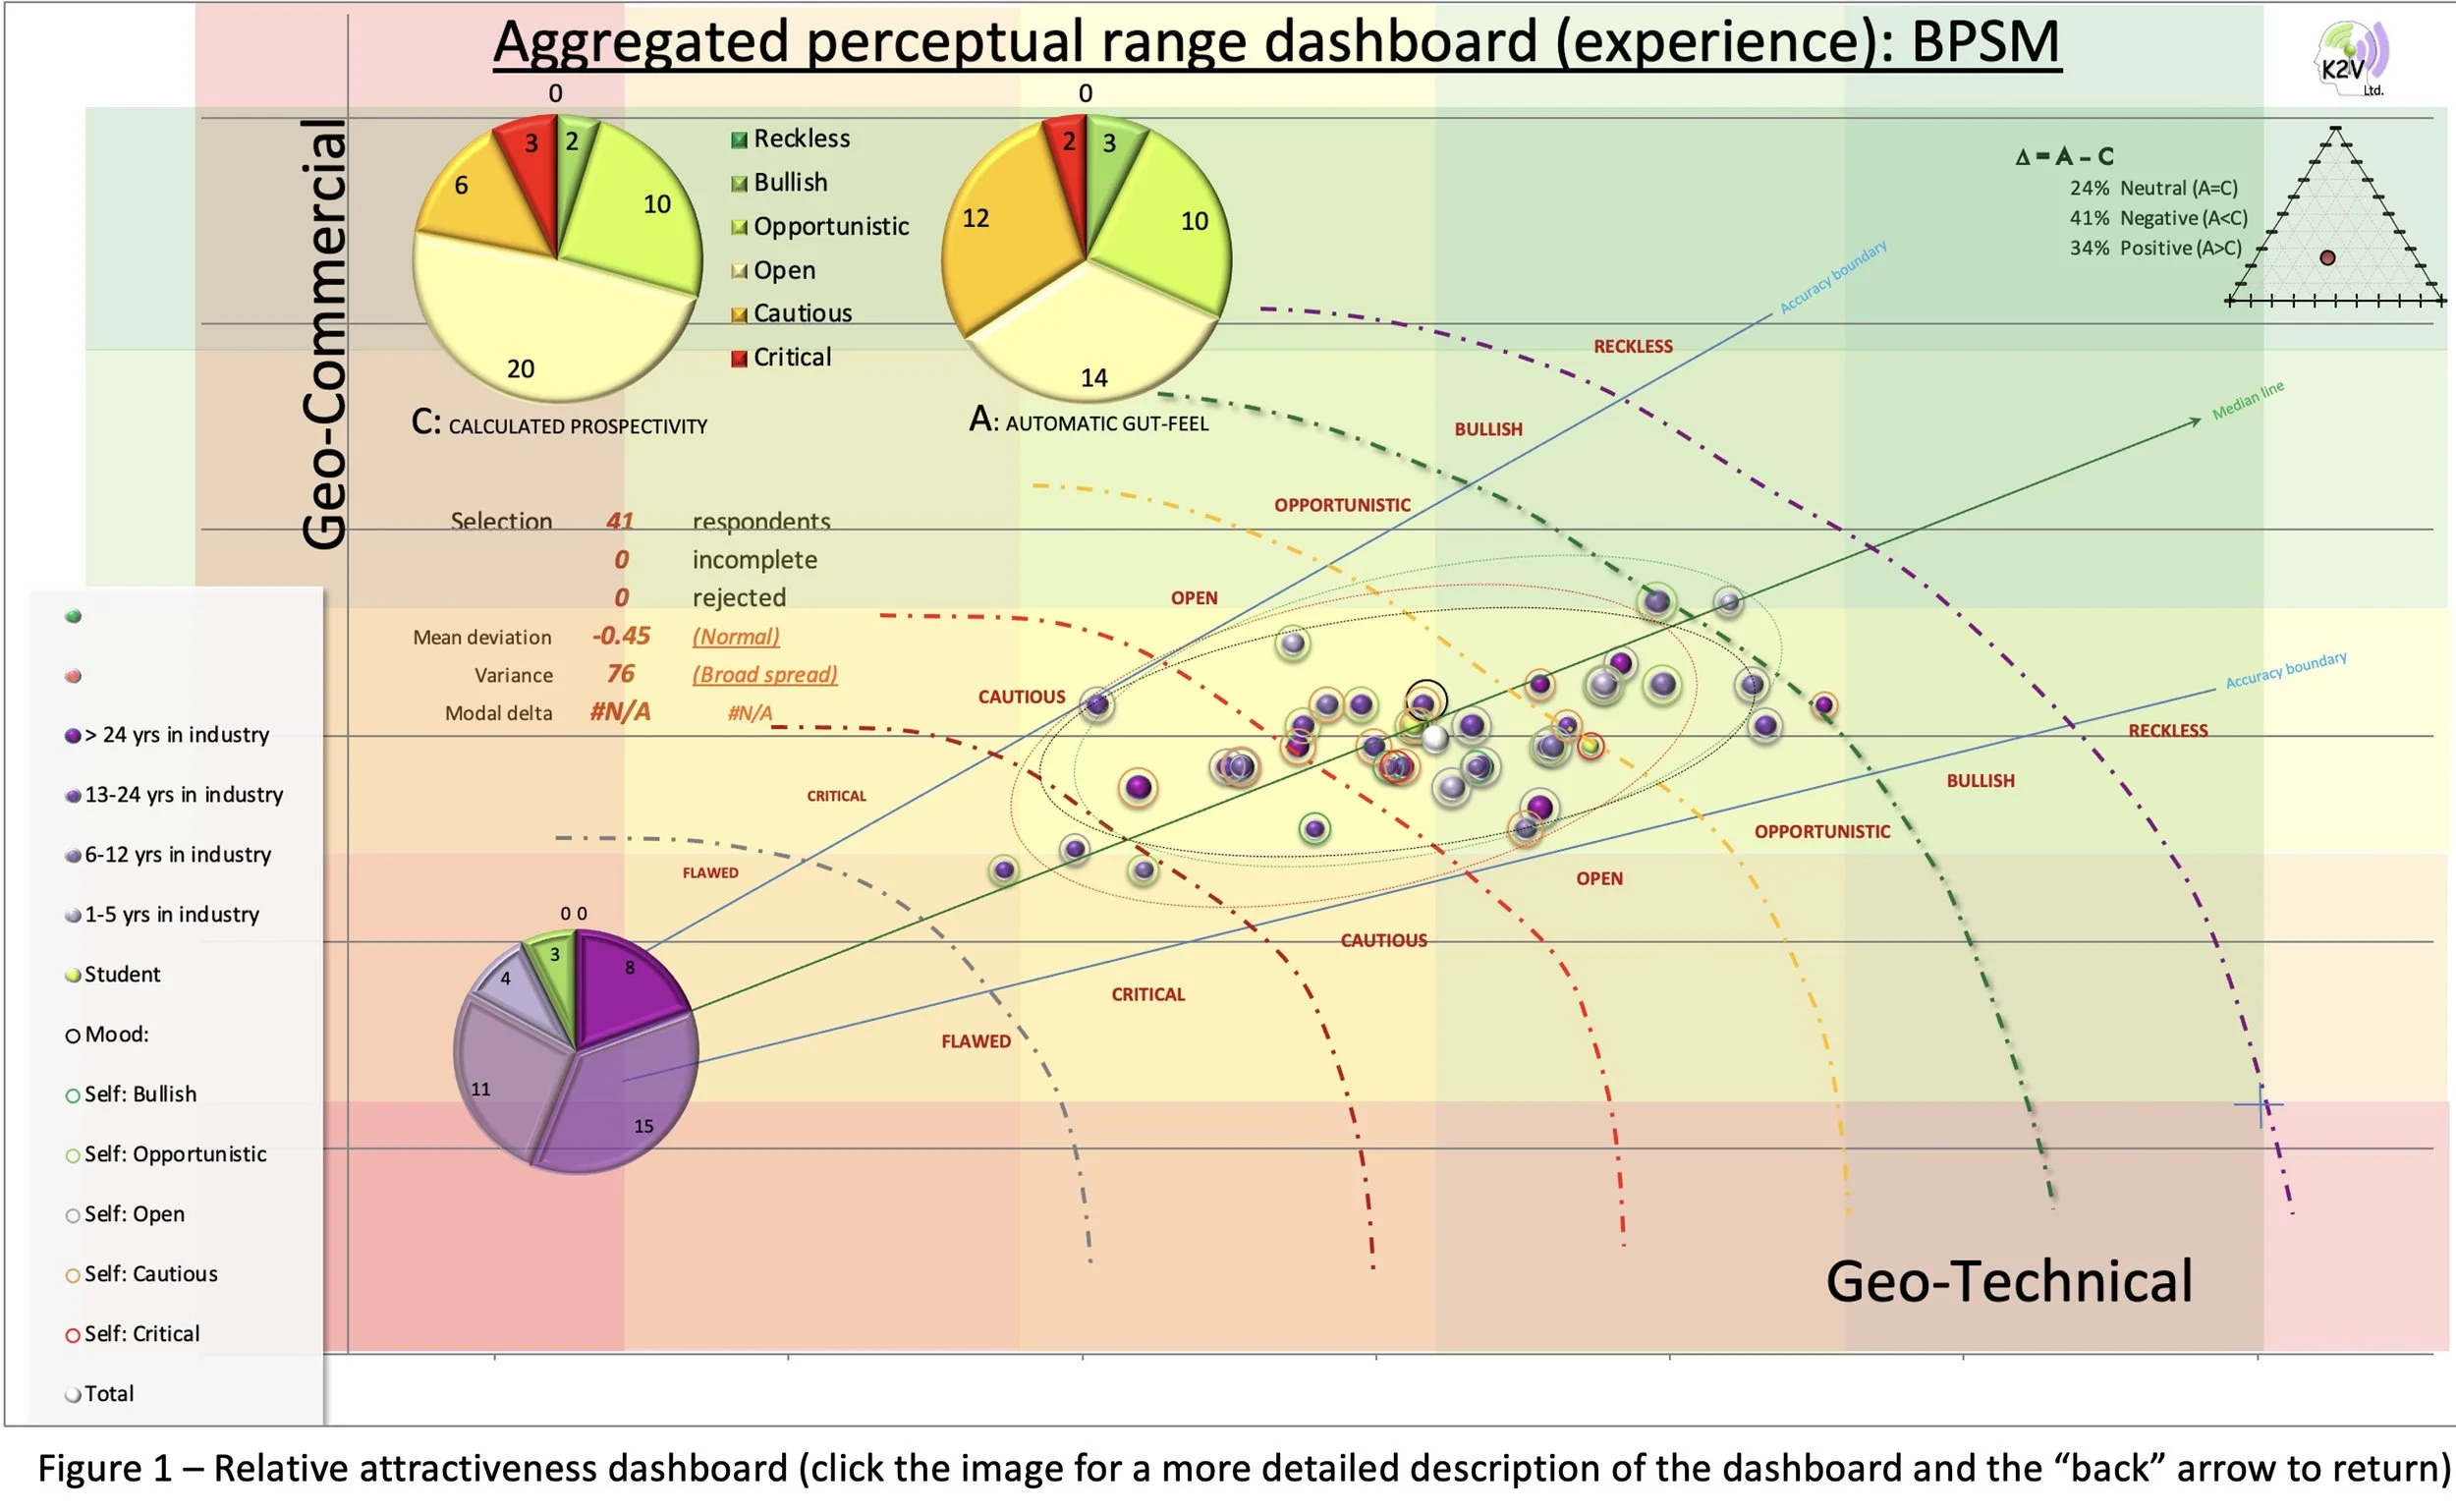
On the 29th September, 2021, a data-room simulation was staged in front of a live audience at the Geological Society of London’s “Basin and Petroleum System Modelling” (BPSM) conference. 49 participants were invited to examine three slides describing a hybrid frontier opportunity in the oil & gas sector. They were given a 10-minute briefing describing the geo-technical and geo-commercial attributes of the opportunity, with gaps in certain aspects and too much information in others. Just like with any dataroom, they were also given very little time to form an opinion on prospectivity, which was elicited using an online questionnaire over a 10-15 minute period. As each individual completed and submitted their assessments, a bubble appeared live on the dashboard below, allowing each participant to identify which was their bubble as they appeared on the screen in front of them.
LIVE RESULTS
Individual Responses
The relative attractiveness dashboard (Figure 1) shows individual submissions plotting as bubbles (coloured by years of experience) calculated from 15 metrics (Geo-commercial vs Geo-technical axes) on a climbing scale (1-5) of relative attractiveness [1) critical, 2) cautious, 3) open, 4) opportunistic and 5) bullish]. Crucially, at the end of the survey, participants were invited to self-report their opinion on how they felt about the overall prospectivity of the opportunity using the same scale of attractiveness.
In reviewing the results live, participants were informed that the plot reveals two modes of thinking: the position of the bubbles reveals their evaluations calculated from each of the 15 metrics they selected (“C”), calibrated on a scale of relative attractiveness. The colour of the “halo” around each bubble reveals how each participant reported their Automatic gut-feeling on prospectivity (“A”) on the same scale. The difference between A & C (the delta) suggests that there is an internal conflict between participants’ opinions and what the data are actually telling them; in effect, a perceptual gap emerges.
Participants were informed that the perceptual gap is “mined” by assigning individuals to one of three categories:
· When A = C, “neutral”
· When A < C, “negative”
· When A > C, “positive”
Participants were referred to the small writing at the top right of figure 1, which indicated that less than a quarter of participants in the live survey (24%) were categorised as “neutral”. The majority were “negative” (41%), with 34% being “positive”. Participants were reminded that the categories “neutral”, “positive” and “negative” are not attitudes or outlooks; they represent gaps between people’s gut-feeling for the opportunity and what they independently observe from the data.
Group Responses
The way that the categories were assigned means that as individuals, we are either neutral, positive or negative. We can’t be all three. Groups of independent individuals are composed of combinations of all three categories and it is by examining the identity of these peer groups (cohorts) that trends in those combinations are revealed. Over the last 4 years, more than 1000 professionals in the oil & gas sector have registered their opinions on this opportunity. It was found that the categories are globally homogeneous, evenly split three ways: 33% for neutral, positive and negative. But for the BPSM group, as we have seen, that balance was skewed towards negative (41%).
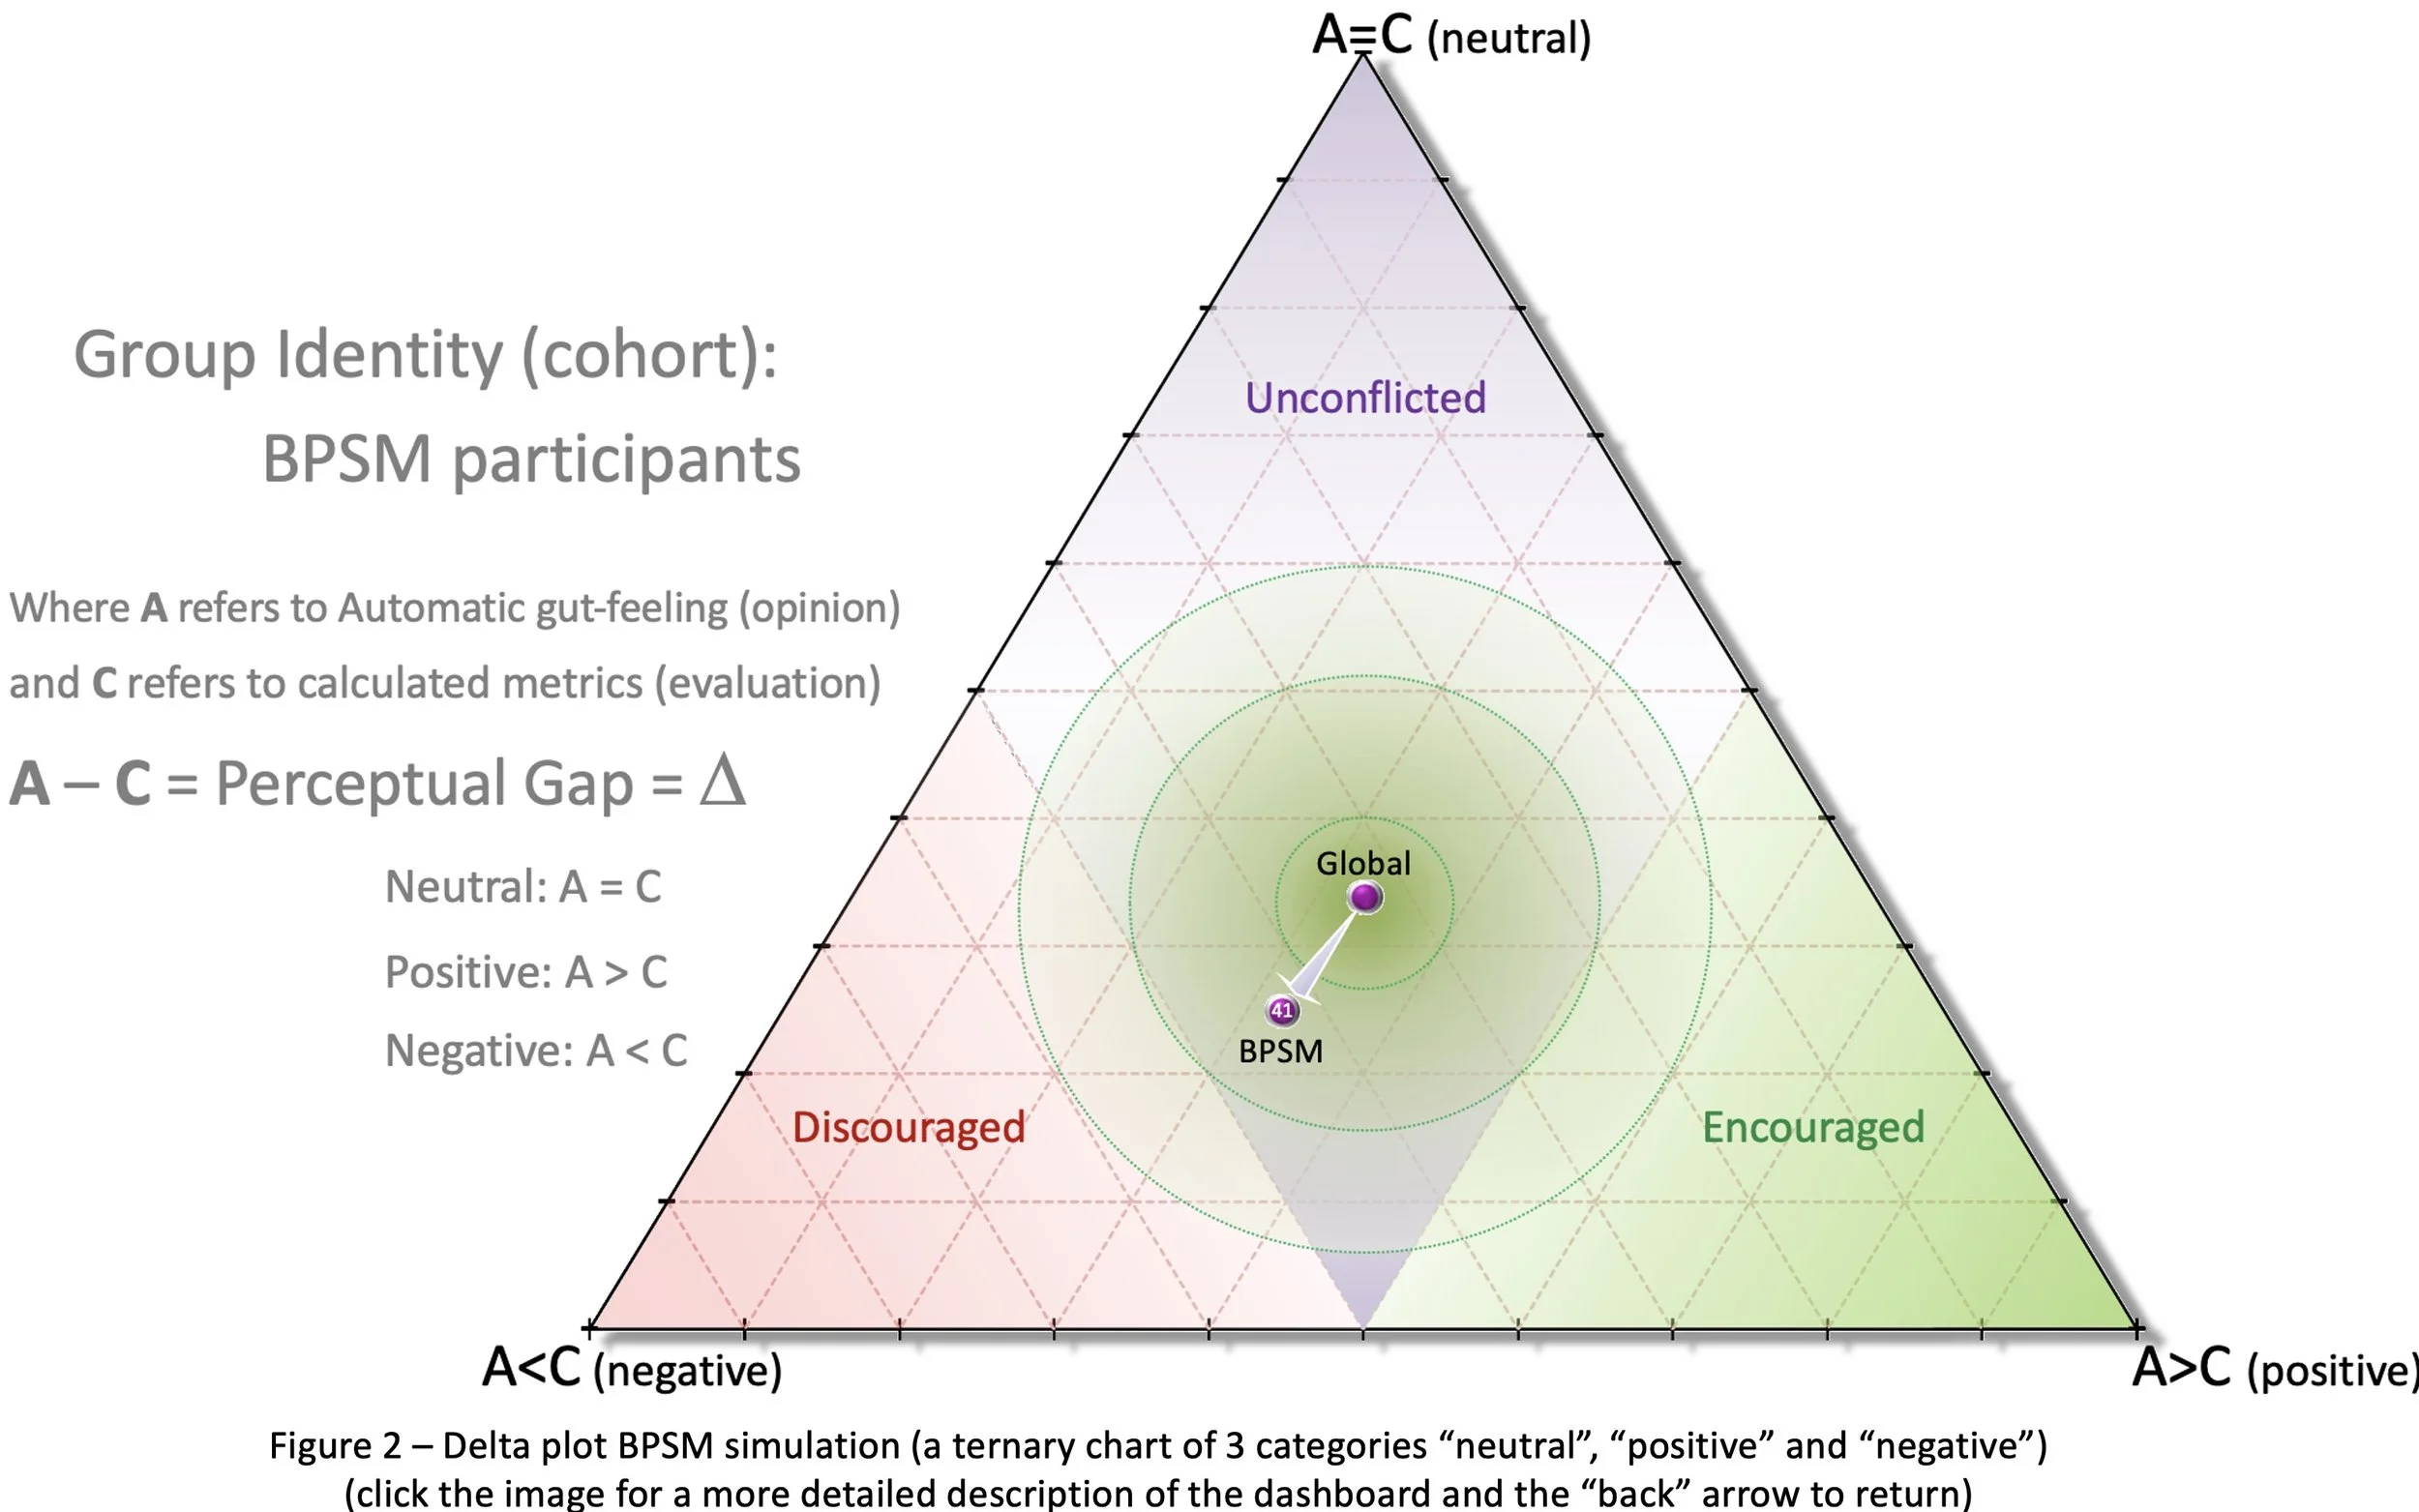
Figure 2 shows the three categories plotted on each apex. The total homogeneous population, where there is an equal mix of all three categories, plots in the centre of the bullseye (Global). Any heterogenity is expressed as a vector (arrow) away from the centre, the visual expression of the identity of each cohort. Those who plot towards the upper segment are less conflicted than those who plot in the red zone (discouraged by the opportunity) and the green zone (encouraged by the opportunity). Figure 2 implies that BPSM participants are deeply conflicted and tend to be “discouraged” by the opportunity in that there were more participants whose opinions were less favourable than what the data were actually telling them.
Participants were not aware during the live session that a fatal flaw had been introduced in this simulation; a flaw designed for petroleum system experts to recognise associated with the presence of source rock. The convener was sufficiently reassured by the live result (negative trending heterogeneity) to perform a live filter on basin-modellers specifically and was astonished by the result. Basin-modellers were completely homogeneous; they demonstrated zero heterogeneity. The convener was unable to explain this result at the time (mildly embarrassing) but after the event, it was immediately apparent that the convener had under-estimated the spread of experience in the room:

The two young professional participants were unconflicted (top apex), which is too small a number to draw any conclusions from. But early career basin modellers (6-12 years) do seem to form positive opinions (compared with what the data are telling them), which becomes increasingly negative with experience – there is a demonstrable swing to negative opinion (compared with what the data were telling them), with a significant increase from internal conflict during mid-career, which coincides with ambivalence about the critical technical risk. Experience really does make a difference for basin modellers.
DISCUSSSION
Challenging Perspectives
Each bubble in Figure 1 represents the independent observations of every participant using the 15 metrics they selected (C) based on the information they received, which was exactly the same for every participant. Each bubble is unique, which means that we perceive and process exactly the same information uniquely. What re-enforces that uniqueness is that the elicitation process is independent; there is no convergence of bubbles from external influences like groupthink. Where the data room simulation differs from “clinical” trials conducted by behavioural psychologists is that in exploration, there is no single right answer (depending on your business model), which is why we aggregate on a scale of “relative attractiveness”. Until our results are clinically replicated and verified by behavioural psychologists (currently underway), this experiment will remain an entertaining side-show, perhaps with the capacity to give our industry pause for thought.
Internal Conflict
The authors asked participants to consider that two modes of thinking were being compared by the simulation; two modes which are most often in conflict with each other:
1. Our automatic gut-feeling for perceived “value” (A) – our opinion or intuitive judgment
2. Our evaluation of the de-constructed components of the same “value” in frontier exploration (C)
What can be problematical for us as humans is that our opinions (A) often overrule our observations (C).Whereas this may not always be a bad thing, it is essential to establish the difference and to understand why they are different. “A” contains a mixed bag of non-unique influences which include preference, experience, risk aversion, stress, what you had for breakfast that morning AND crucially bias. Errors of judgment are made in moments of stress (like a dataroom), when we may not have time to examine all the data critically and rely on our gut-feeling to bridge the gap. “A”, then, may have little to do with what we actually observe, and is subjective. “C” is much more focused on what we deduce from the information supplied and is arguably more objective. The authors call the delta between A & C the “perceptual gap”, which is a bucket term combining all the influences that shape attitudes and behaviours. The simulation conducted at the Geological Society demonstrated the effect of experience on expert opinion. But the same perceptual gap also contains amorphous components like uncertainty (in the data) and noise (how the questions are perceived) as well as directional components like preference (related to values, which may be desirable) and bias (related to beliefs, which can introduce errors).
What does any of this actually mean? (New Insights)
…we don’t really know but we can make some observations. The BPSM simulation has revealed a swing from positive to negative (categories) with increasing experience in basin modellers (figure 3). One way of interpreting that swing is to suggest that early career basin-modellers are prone to substitution bias, unconsciously inflating the importance of the few real cases they have experienced, with new opportunities. The resulting over confidence bias has the effect of distorting their intuitive gut-feeling without altering their observations, which are completely valid. Even if they recognise that charge is the weakest link (which many do), early career practitioners do not have the experience to separate the relative importance of charge from the other value-determining metrics and so they express their beliefs based on what they do know works. At the other end of the scale, experienced basin-modellers know perfectly well from the many potential analogues they have experienced that an absence of charge is a killer risk, whatever the other metrics may be telling them, to the point where they may even become perceptually blind to other metrics (if there is one killer risk, then other metrics have limited value). Experienced practitioners realise that any killer risk condemns an opportunity, which creates an over confidence bias to reject the opportunity quite quickly (which in this case is probably correct). They too are expressing their beliefs because even experienced hands are more influenced by what they do know, which may give them the confidence to reduce the importance of what they don’t know. Mid-career basin modellers appear to be more conflicted than either early or late career practitioners, perhaps because they have more analogues than early career but can make fewer assumptions than late career. Arguably, they are less prone to over confidence bias than those less or more experienced than they, possibly even more critical of what they see in the data and more open to what they know they don’t know and its relative importance.
These are generalised observations based on cohorts, which are composed of individuals who do not necessarily represent the collective trend. Detecting bias in a group of individuals is essential for decision makers, who can compensate for identifiable errors in support of decision making. Experience from experts demonstrably helps to converge on the best possible solution for an enterprise. But the maverick opinion of individuals is important to recognise because they are either wrong or they know something that others do not know, which can be verified with a simple conversation. The simulation has demonstrated that for any opportunity evaluation in any enterprise, it only takes an hour to elicit opinion from your entire organisation (if you choose) to support decision making.
Decision Making
The opportunity screening technique behind the dataroom simulation refined over the last four years has repeatedly demonstrated the ease with which large numbers of knowledge-holders can apply their content knowledge in support of decision making. Broadening the college of opinion in this way has always been viewed as divergent, which all projects engage in their early stages, before converging on more focused delivery options prior to making key investment decisions. Focus is another way of abandoning possibilities, which still exist even though they have been rejected as the shifting economically driven opportunity landscape evolves. Focus also has the potential to reinforce unconscious cognitive behaviours which can distort reality, risk eroding value and may go unchecked without screening.
Follow up
It is hoped that the delta plot will in the future assist in separating out directional components as repeatable vectors for distinct group identities (cohorts). This can only be achieved by repeating the experiment with more diverse groups. The simulation at the conference has greatly assisted the authors in achieving this. Of the 41 delegates who participated in the simulation, 28 requested feedback on their personal scores, which they have now each received and which included speculation about their attitudes to risk. K2V Ltd (a non-profit organisation dedicated to converting Knowledge-to-Value) will continue to explore methods of elicitation in support of decision making inside and outside the oil & gas sector and to develop methods of measuring bias, preference and perceptual blindness and to compensate for their influence on decision making. The BPSM simulation has demonstrated that it is a lot easier to identify bias and compensate for it than it is to change natural behaviours, which is unsustainable.
CONCLUSION
Mining the wealth of overlooked knowledge applied to a single opportunity elicited within the space of an hour has revealed perceptual breadth and depths that we are only just beginning to understand. If it really is that easy to consistently measure veracity and errors in thinking, there remains no excuse for not doing so in support of decision making. But there is a long way to go to verify any such claims. The BPSM simulation was the first single session where the depth and breadth of knowledge demonstrably influenced expert opinion*. That conclusion was only achievable because BPSM provided sufficient numbers of individuals whose expertise was specifically targeted at a known flaw in the data. This allowed us for the first time to identify the importance of experience and to potentially identify a source of overconfidence and to measure it, which is difficult to isolate in more mixed combinations of expertise. How you blend perspectives (whose opinion you elicit) to contribute to decision making is shaped by the business question driving the elicitation.
We have identified the existence of a perceptual gap between participants intuitive gut-feeling for an opportunity and what the data are actually telling them – a gap which is measurable as a vector. This vector has a practical application in support of decision making but with appropriate verification, can it also illuminate the human condition? Good science is occasionally experiencing the triumph of the unexpected but you also have to be able to spot it; the experiment continues.
ACKNOWLEDGMENTS
The authors would like to thank David Rajmon for inviting us to present the simulation at the BPSM conference, the conference committee for enthusiastically agreeing to it and the Geological Society for hosting it. The authors would also like to express their gratitude to Professor Stephen Begg and Dr. Matthew Welsh (Australian School of Petroleum & Energy Resources, Adelaide University) for their continued challenge and support. Mostly, our thanks go to the 49 participants who did all the work in the live session and who gave their feedback afterwards, improving the quality of the outcome.
email: info@k2vltd.com to request A4 print copy
*If the use of knowledge to attain our goals really is the seat of rational thought (Pinker, 2021) then what greater incentive can decision makers have for engaging knowledge?
FURTHER READING:
· Kahneman, D, 2011 – Thinking Fast and Slow. [Farra, Strauss and Giroux, ISBN 978-0374275631]
· Kahneman, D., Sibony, O., Sunstein, CR., 2021 – Noise [HarperCollins Publishers , ISBN 978-0008472566]
· Loftus G.W.F., 2021 - Eliminating bias from decision making in the oil & gas sector... [LinkedIn article - https://www.linkedin.com/pulse/eliminating-bias-from-decision-making-oil-gas-sector-guy-loftus/]
· Pinker, S., 2021 - Workbook for Rationality by Steven Pinker: What It Is, Why It Seems Scarce, Why It Matters [Bright Press, ISBN 979-8494503114]
· Welsh, M., Lee, M and Begg, S., 2008 - More-or-less elicitation (MOLE): Testing a heuristic elicitation method [Proceedings of the 30th Annual Meeting of the Cognitive Science Society (CogSci 2008), 23-26 July, 2008: pp. 493-498]