Eliminating Errors in your Oil & Gas Portfolio
29th April, 2019
Companies A & B invited K2V Ltd. to conduct live interactive sessions in their offices to examine how corporate knowledge sharing can be engaged in support of decision making. Both companies currently operate in the upstream oil & gas sector and both have their knowledge holders spread over various locations around the world. The two companies operate under entirely different business models, however. The live sessions were informal “lunch & learns” and one of the companies supplemented numbers with offsite locations dialling into the session. This article presents a broad overview comparing potential biases and how the techniques introduced by K2V have been used to test the robustness of portfolios in support of decision making.
DEALING WITH BIAS
Value of upstream portfolios is expressed as ranges based on scenarios, because no one knows the true value until it has been realised, compelling investors to take a punt on prediction. Ranges are required to cover gaps in data, knowledge and/or understanding, keeping the aperture as wide on uncertainty as is feasible to actually make a decision. How those gaps are managed partially determines whether an opportunity will create or erode value for the business [1]. Investment in a single opportunity within that portfolio is a discrete dollar number based on a risked deterministic prediction within the uncertainty distribution. The deterministic prediction will always be wrong, but the error can be absorbed by risk spreading across the greater portfolio [2], particularly if the investment profile can be revised up or down through learning.
The challenge is to reduce the number of errors that contribute to the uncertainty distribution, which underpins the deterministic dollar value. One of the most frequent sources of error is human bias, which Rose & Associates is actively working with companies to mitigate [3]. It is the forced compromise between keeping the aperture wide on uncertainty and committing a single investment figure, which could be hundreds of millions of dollars, that generates tension in an organisation leading to bias. Decision makers often rely on trusted experts to guide their choices but if the experts themselves can’t agree on the predictions, decision makers are compelled to make choices that they may not be qualified to make. If a manager says to you “…yes, but would you put your money on this opportunity?”, that manager is forcing your bias. The solution proposed in previous articles [4,5] has been to access broader opinion within your organisation and collapse cognitive bias mathematically to underpin an informed discussion about prediction with the experts. And to achieve that within the space of an hour! Bias is both detectable and avoidable, although the techniques being used by K2V Ltd are still experimental, requiring independent verification. Does your organisation keep the aperture wide on uncertainty in support of decision making or is it fostering a hidden culture of bias?
EXPERIMENT
Over the last two years, K2V Ltd has been conducting an experiment, touring institutions and companies around Britain to collect opinion on predicting a frontier exploration opportunity using a simulated data room. What has emerged so far is a calibrated method for establishing how equally informed opinion varies between different groups of participants. The experiment began with “Knowledge Stacking” [4] to assess if crowd-sourced predictions for opportunity identification converge on the actual value of that opportunity. In practice, convergence to a stable average can take hundreds of guesses. Deconstruct the same guesses by broadening the criteria does accelerate that convergence.
More recently, K2V began opening up the experiment to include companies operating in the oil & gas sector to fill a demographic gap.As an illustration,companies A and B were selected for their known contrasting perspectives to examine how bias can be detected in their responses.The figure below compares their spreads of perceptual range in what have become standard plots (clickHEREfor a more complete explanation of “perceptual range” plots).
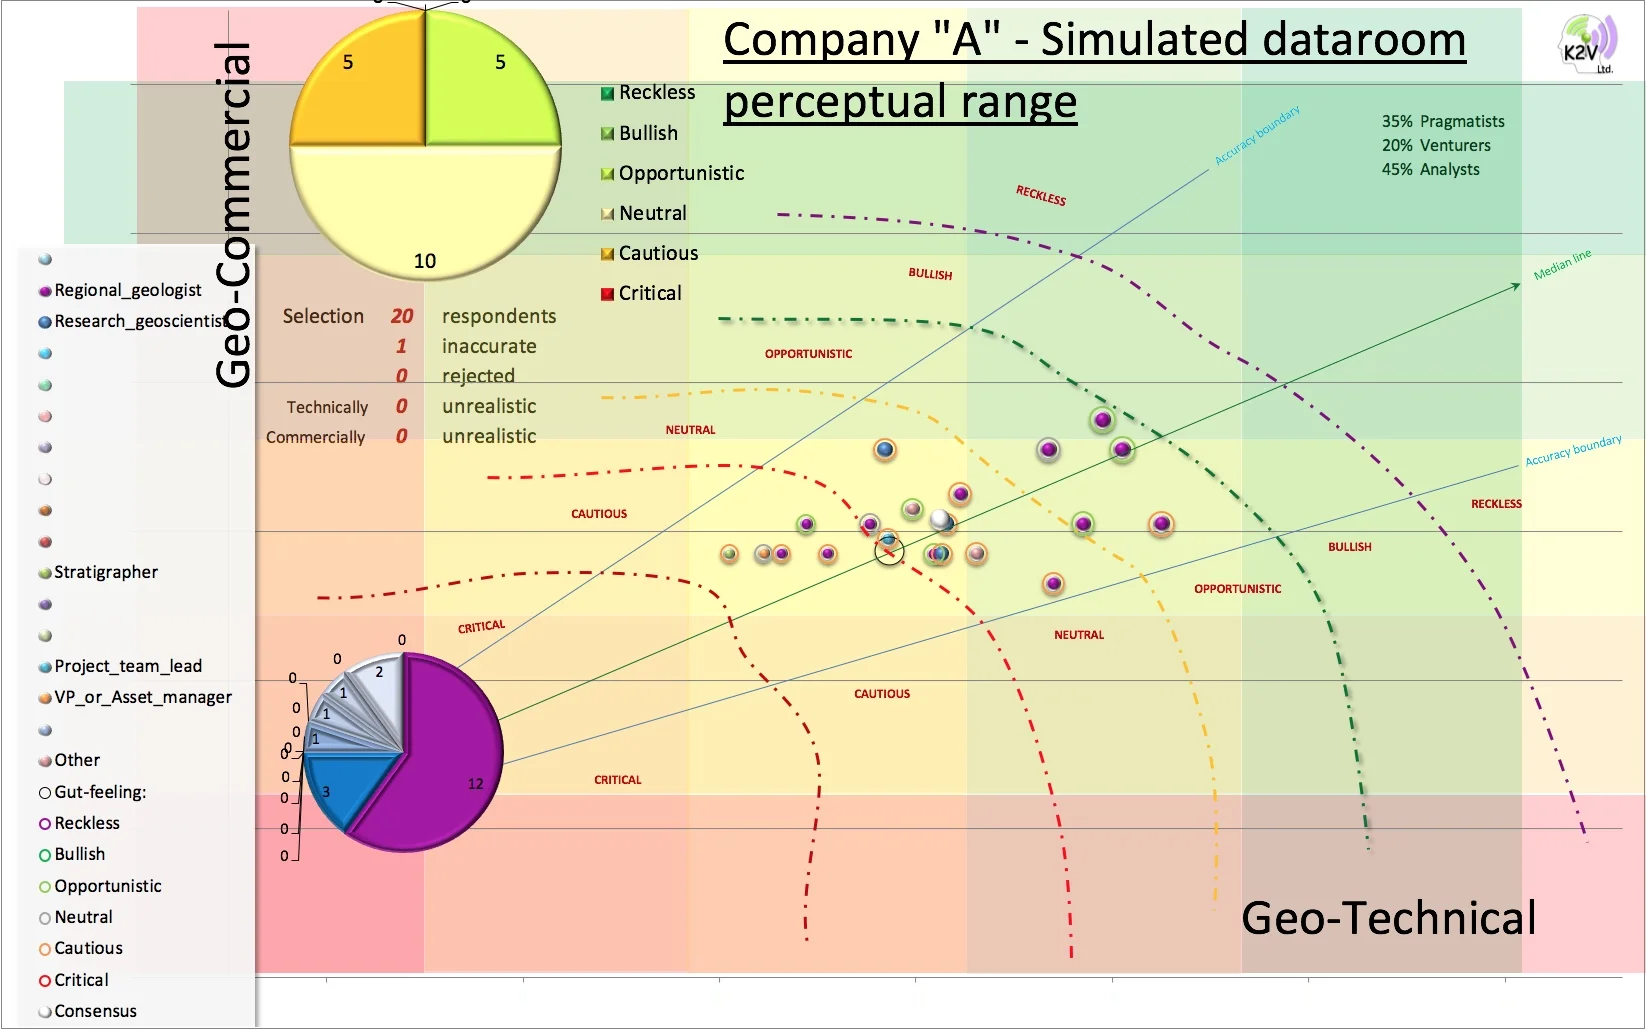
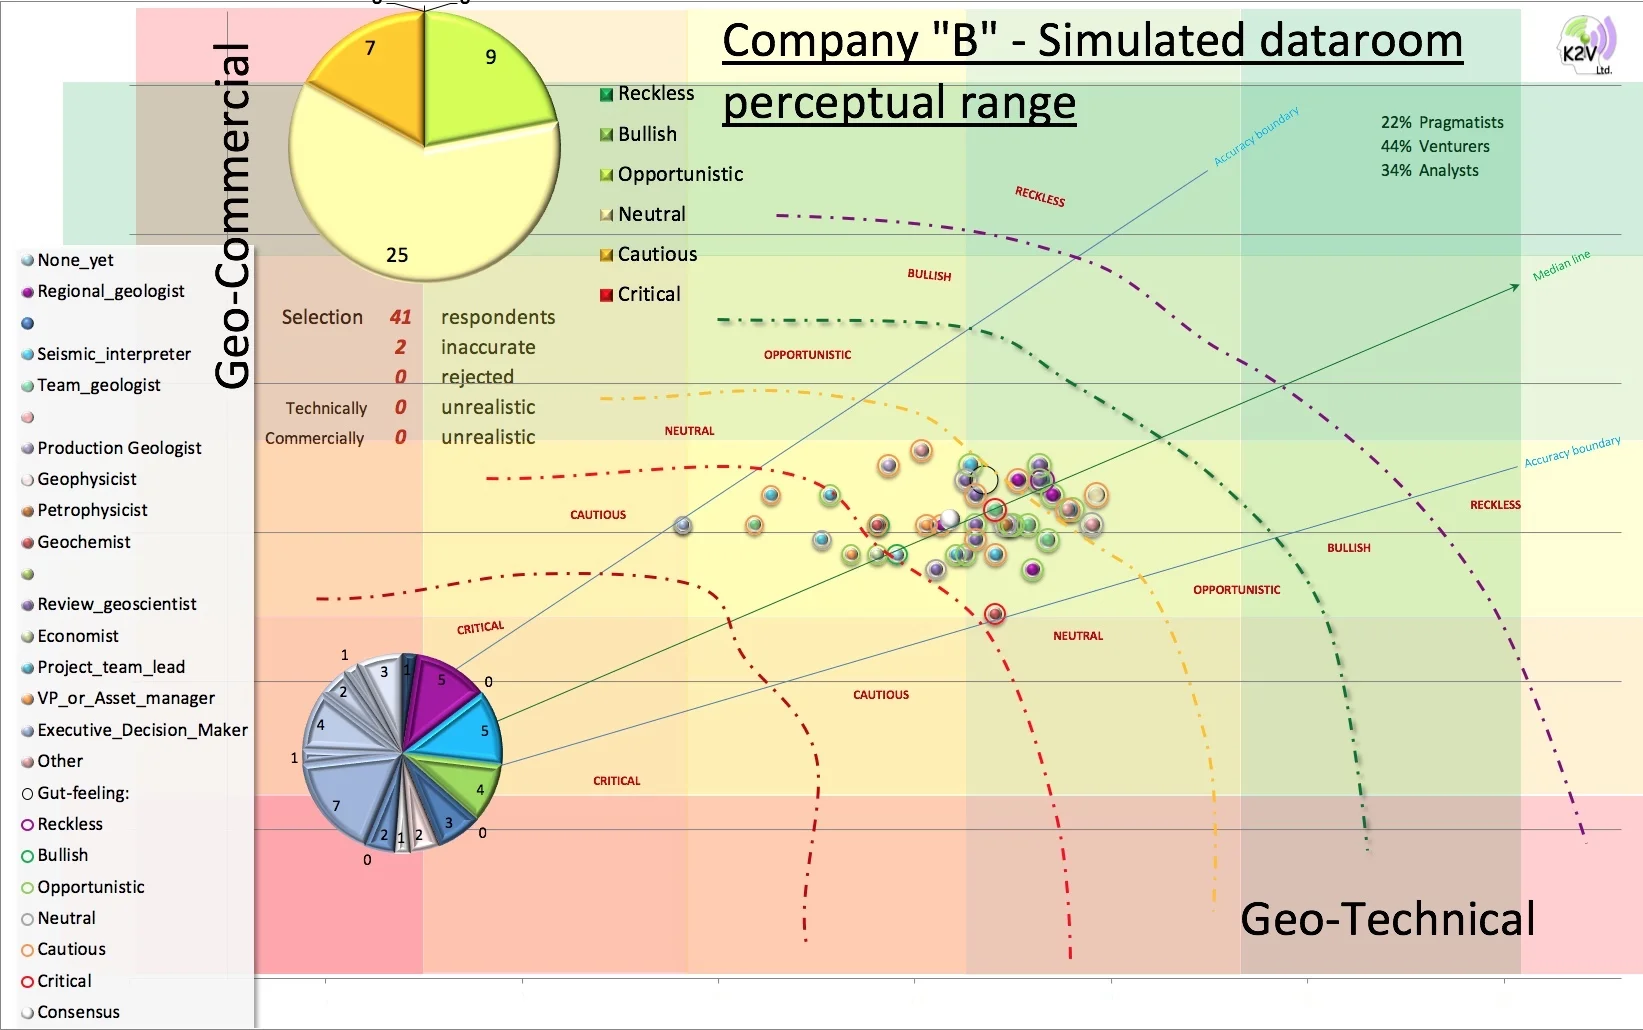
The location of each bubble represents the evidence-based predictions of each participant on a scale of optimism (critical, cautious, neutral, opportunistic, bullish and reckless). Company A registers a broader spread of opinion than company B, even though the number of participants in “B” is twice that of “A”. Exactly half of “A” plot in the “neutral” zone, with the remaining evenly split between opportunistic and cautious, which is consistent with the gross population of over 400 respondents. An unusually high proportion (60%) of “B” plot in the “neutral” zone, with a slight skew towards opportunistic versus cautious.
Bias collapsed- The spread of opinion does not, in itself, represent bias. In fact the white bubble (labelled “consensus”) on both plots (representing the aggregated average for each company) are almost identical, showing that their biases collapse to about the same outcome, even if for different reasons. We know from the literature that if you ask a large enough group of diverse, independent people to make a prediction or estimate a probability, and then average those estimates, the errors each of them makes in coming up with an answer will eventually cancel themselves out [6]. The story should end there because cognitive bias has effectively been collapsed: job done. But it turns out that is not the whole story because the same outcome was not achieved for the same reasons. The overall decision may be the same but the investment profile will be completely different. Even though the assessment is only based on one opportunity, there appear to be biases in both companies, which need to be understood if they are to be value-adding for either of them.
Bias revealed– Last month’s preliminary results revealed a gap between participants’ reflexive gut-feeling on prospectivity as a whole and their more evidence-based de-constructed predictions [5]. The larger black open circle on each plot represents each company’s average gut-feeling, which is more optimistic than the evidence-based predictions for company B and less optimistic for company A: “B” is biased more in favour towards the opportunity than “A”, which appears to have an equal opposing bias.
These results are projected on the screen during the live sessions in the space of around 40 minutes.None of the participants had time to exchange opinions, they simple responded with their viewpoints in confidence, implying that the bias reflects corporate culture, as each entry is independent.If either company had conducted an open discussion with the same group of people, the outcome would almost certainly have been very different (GroupThink).To find the nature of the bias and how that might influence their investment profile, we have to examine their deconstructed predictions more closely.
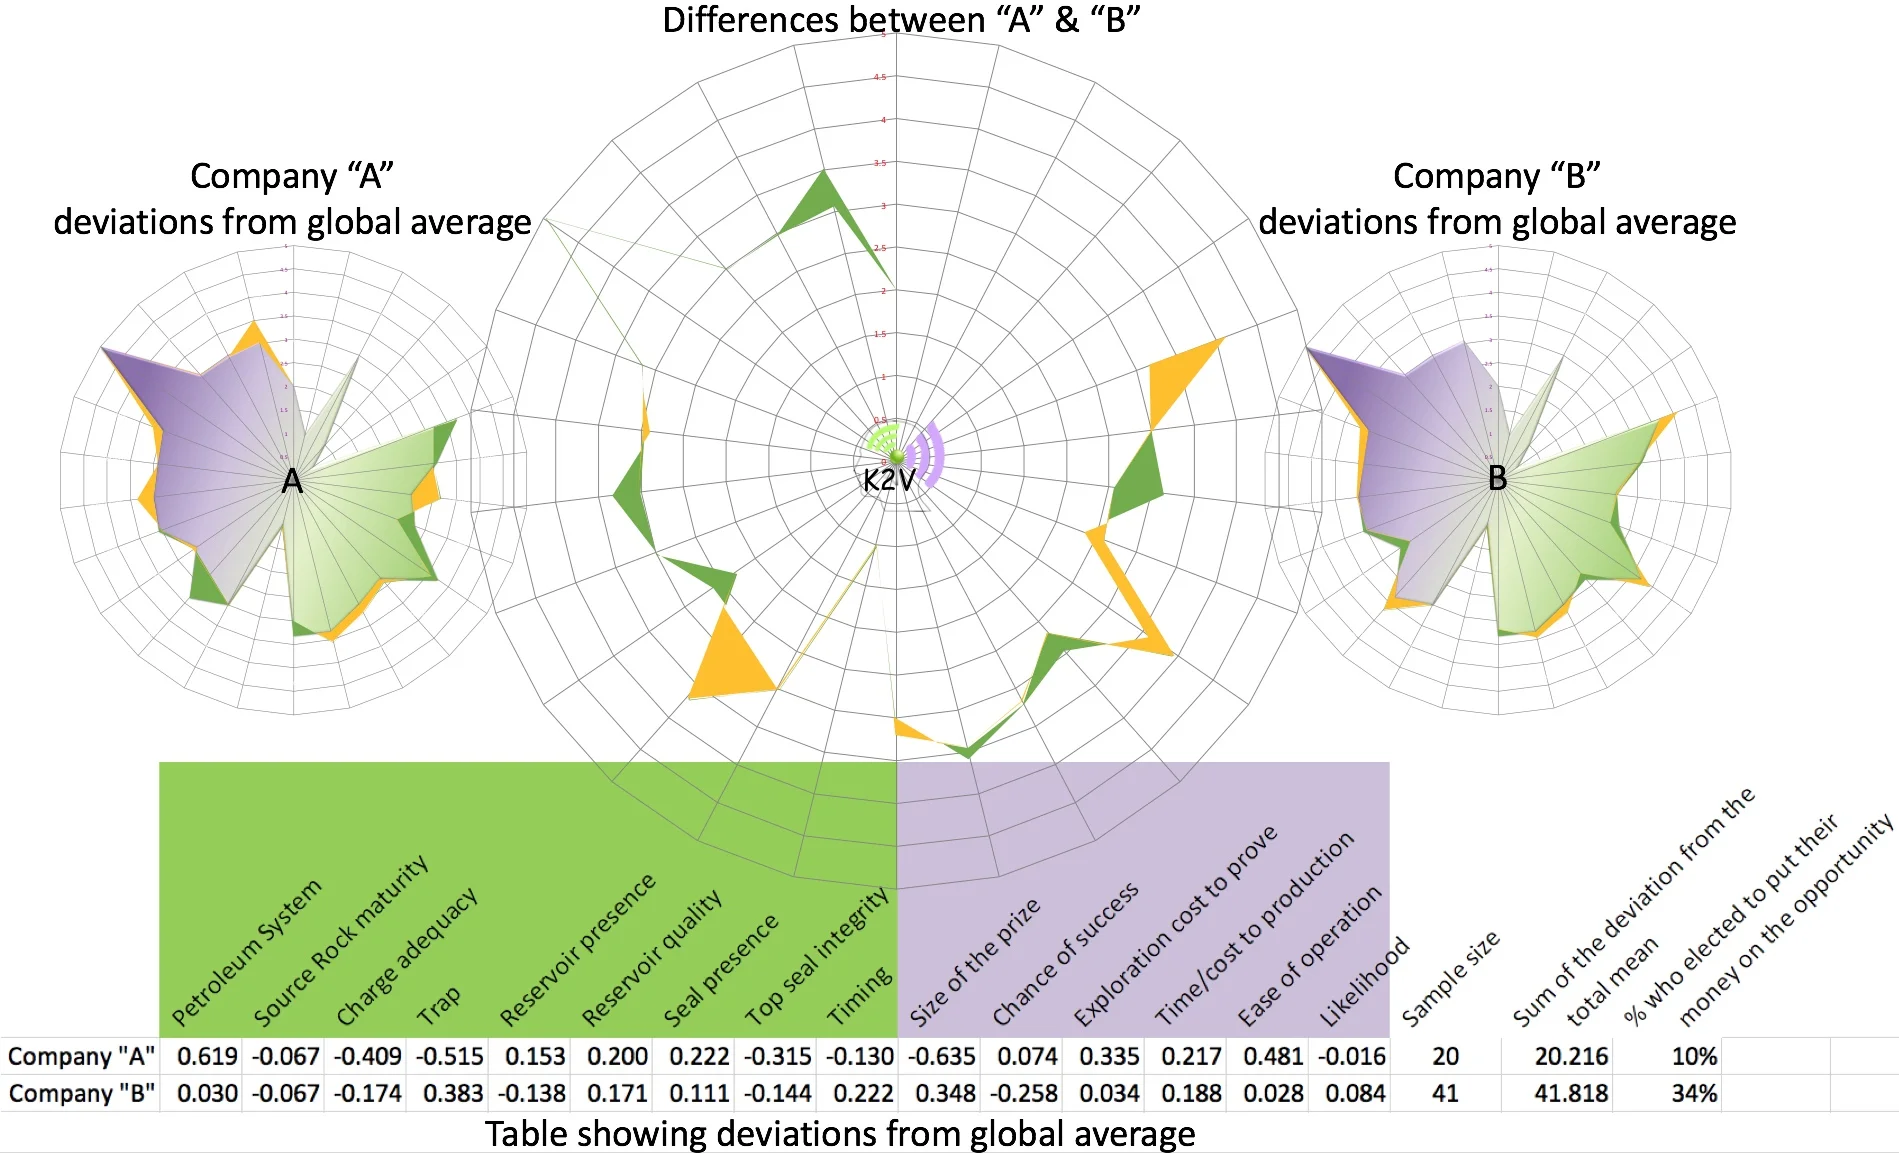
The radial charts above show the gaps between the two companies in the centre plot, comparing them with the global average in the table beneath. The orange polygons in the centre denote where company B predicted higher than company A and green polygon where “A” predicted higher than “B”. The companies differed significantly on the trap style and the existence of a working petroleum system, which had a knock-on effect on the “size of the prize”. The radial chart on the left side shows that “A” departs quite significantly from the global population on these attributes compared with “B” on the right side. The last column in the table shows that participants in company A are significantly less willing to commit their money to the opportunity than those in company B.
Aggregating opinion is a quick way to collapse bias but what is even more interesting are the predictions of those individuals who fall well outside of the mean.What do they know that the rest don’t know or are they just wrong?These opinions need to be engaged to ground-truth and challenge aggregate predictions.
KNOWLEDGE TO VALUE
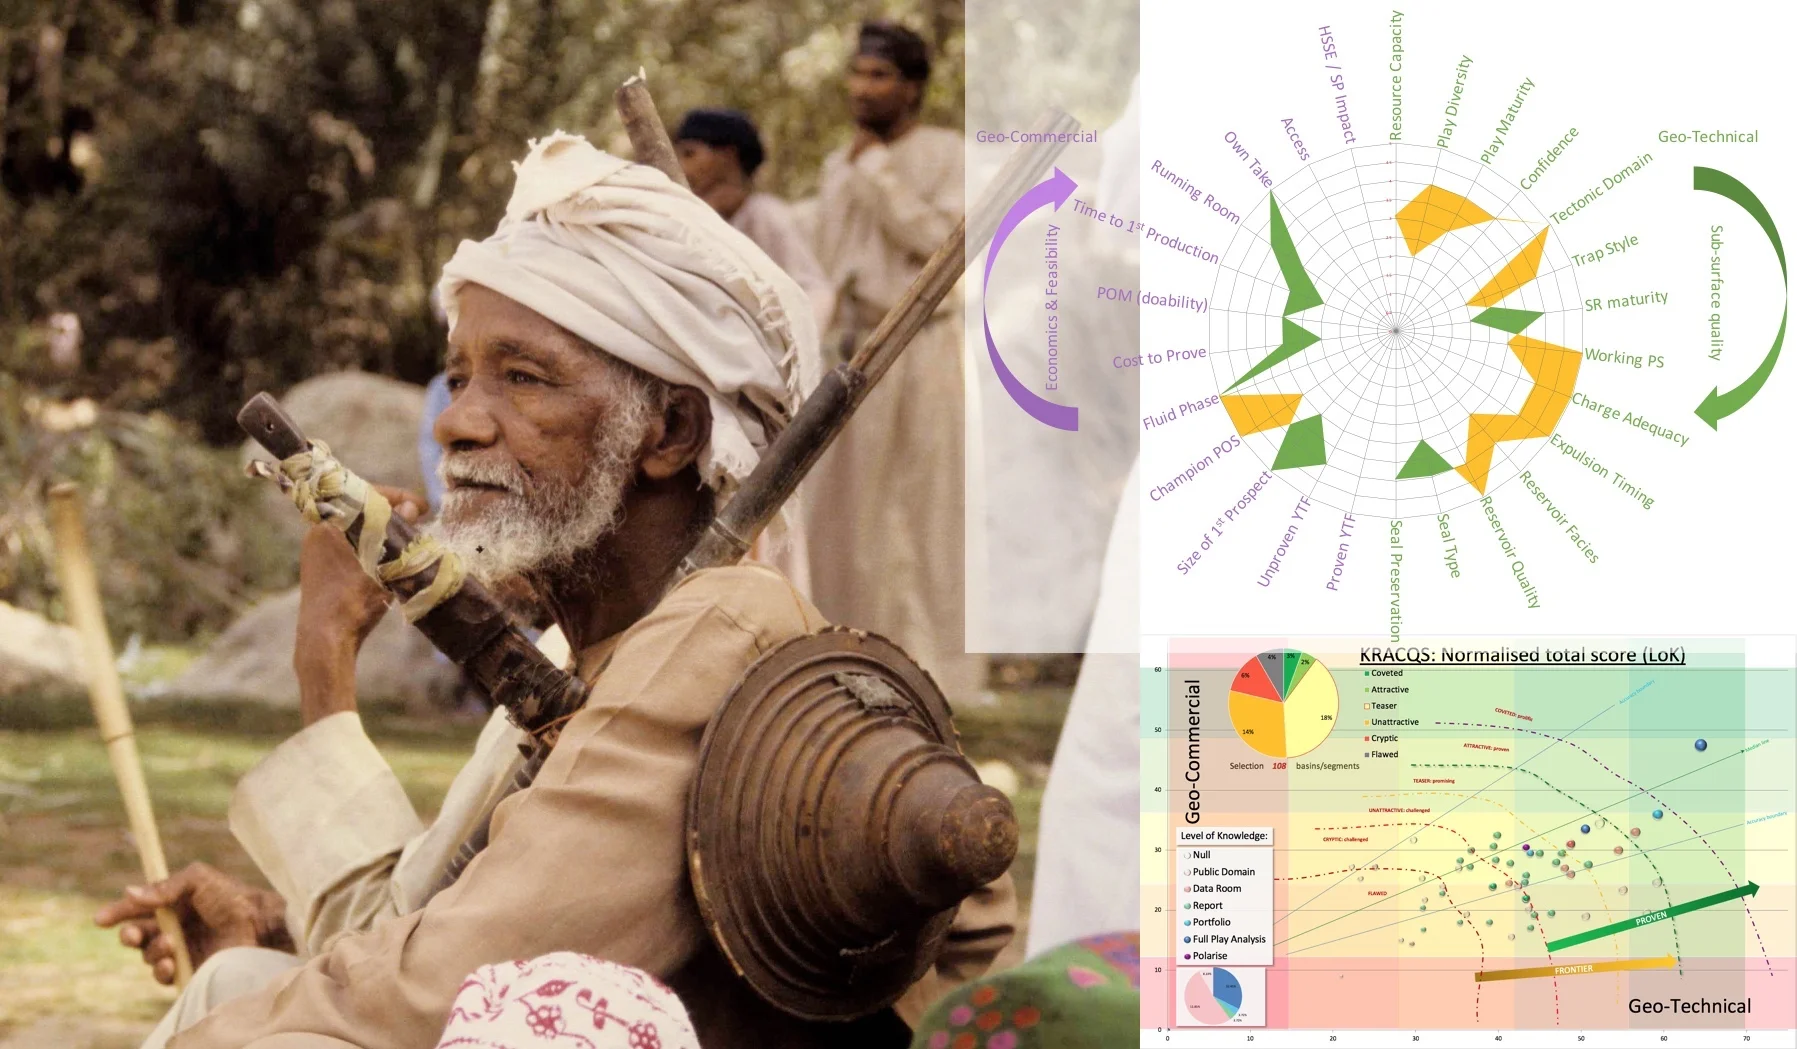
Bias is an error in thinking [7] and, rightly or wrongly, is only challenged if your company is going through a period of exploration failure, and you are looking for a way out. It is also important if your company has recently merged with another because you want to capture the success related behaviours and not inherit errors in thinking. No one in your company is interested in bias if you are successful because the culture of industry rewards success, not the reasonsfor success. Had you conducted this exercise in your own organisation, you would now know if you have an issue with bias. Even if your organisation shows signs of bias, you still don’t know if it is systemic or if it is just an anomalous response to that one opportunity; hold that thought for a moment... The attributes used in the experiment are the same as those used to define value for portfolio assessment [8,9], weighted for different business models. The bubble plot below shows how the optimism scale from the experiment switches to a scale of perceived value (flawed, cryptic, unattractive, teaser, attractive or coveted), where every bubble now represents an individual opportunity of the same global play, irrespective of how many knowledge holders have contributed to that aggregated value statement.

Conduct the same live interactive session within your organisation on real opportunities and comparing the outcome with the simulated experiment, will demonstrate if that bias is repeated or if it was just in response to that one opportunity.
Understanding how knowledge can be applied to value is the sole purpose of K2V Ltd (Knowledge to Value).
CONCLUSIONS
Acknowledging how bias contributes to decision making is essential for the continued health of your business. Errors in thinking are important to remove but equally, predictions that fall outside of popular perceptions must be preserved because they may hold the key to a completely different outcome. Our capacity as humans to predict complex outcomes from multi-variate conditions is on the whole, not good. It doesn’t matter how much experience we have, we are still not good at making guesses about single value statements. Aggregated knowledge eventually converges on a stable outcome if the sample size is large enough but where experience may contribute is being able toaccelerate that convergence. However complex the prediction, there are only two questions of interest to exploration in the oil and gas sector:
1. How robust is the petroleum system? And
2. Can we make any money out of it without hurting anyone and without damaging the environment?
The techniques showcased by companies A & B may not be able to provide answers to all questions relevant to those companies but they can provide a framework to have a dialogue around potential outcomes. Aggregating the rich lode of knowledge in your company has the potential to remove errors in thinking that lead to errors in decision making, by applying all of the knowledge that might otherwise remain inaccessible across organisational silos.
In the interests of research, and maybe even to your business, K2V Ltd is willing to extend the experiment to your organisation using the same simulation for the cost of one person getting to and from your place of work.Each event lasts up to 50 minutes in a live interactive session: the results appear on the screen as participants register their predictions (multiple locations can dial-in simultaneously across the globe if required). Click https://lnkd.in/eThTY8G to read more about the experiment.
REFERENCES:
[1] Guy Loftus, Allan Scardina, Peter Burgess and Simon Neal, 2018 – Thinking Outside the Play [GeoExPro Magazine, Vol 15, No. 5-2018]
[2] Loftus, Guy W.F., 2017 - Risk Optimisation (a ‘novel’ approach for frontier exploration). Geol.Soc.Lon conference “Managing Risks across the Mining and Oil and Gas Lifecycle”, July 2017
[3] Marc Bond and Creties Jenkins, Mitigating Bias, Blindness and Illusion [https://www.roseassoc.com/mitigating-bias-blindness-and-illusion-in-ep-decision-making/]
[4] Knowledge Stacking [www.k2vltd.com/article-6]
[5] Guy Loftus and Bond, M, 2019 - On the experiment to COLLAPSE COGNITIVE BIAS [www.k2vltd.com/article-21]
[6] Surowiecki, J, 2005, The Wisdom of the Crowds [Anchor Books ISBN 978-0-385-72170-7]
[7] Kahneman, D, 2011 – Thinking Fast and Slow. [Farra, Strauss and Giroux, ISBN 978-0374275631]
[8] [www.k2vltd.com/article-7]
[9] [www.k2vltd.com/article-11]