Knowledge Stacking Scrapbook

How has knowledge ever helped in the search for the truth?
A crowd in search of the truth
Converting knowledge to value is normally a collaborative process between knowledge holders, who agree a consensus view of value drivers, which in effect collapses cognitive bias. Some oil & gas organisations, however, are made up of siloed business units intended to prevent information sharing between knowledge holders across organisational boundaries for legal reasons. In the absence of collaboration, another mechanism needs to be devised to collapse cognitive bias. K2V has designed a potential method called Knowledge Stacking, which allows multiple instances of the same evaluation segment in the KRACQS™ database, in effect, facilitating crowd-sourcing of relative value.
K2V has been conducting an experiment using a simulated data room since September 2017 to establish if independent crowd-sourced opinion is capable of providing the means to mathematically collapse cognitive bias in support of decision making. The challenge is to establish what size of population is needed to achieve a statistically valid result (i.e. critical mass).
Some 480 geoscientists have so far participated in the experiment, which was supported by live lecture tours to a number of geology faculties and organisations around Britain. Participants were supplied with an information pack of three summary slides containing commercial background, play and prospect information, and were invited to role play. As with every data room, there were both gaps in information and an oversupply of detail in some areas. Participants were asked to indicate whether they would have elect to participate in an opportunity (i.e. judgment or “gut-feeling”) and their responses were compared with a calculated value derived from 20 geo-technical and geo-commercial observations. Where individuals plot in graphs presented below is still a guess but it is more accountable than the overall judgment because it is under-pinned by premises that we recognise. In effect, we establish the credibility of the whole by summing its parts and then comparing the two as separate perspectives to examine the differences.
Despite the complexity of informational challenges presented to participants in live sessions, it took them no more than 10-15 minutes to complete their observational scores, which appeared live on the presentation screen as they submitted their responses.
This page is intended as a kind of journal to provide updates for the experiment as they unfold for those wishing to follow progress.

October 2016: devised stacking concept
December 2016: canvassed O&G companies' knowledge sharing capacity
March 2017: researched mathematical premises
April 2017: designed university simulation and canvassed universities for willingness to participate - 8 of 9 faculties canvassed consented to participate.
May 2017: delayed experiment to coincide with the new semester in the autumn.
11th September 2017: published LinkedIn article on Knowledge Stacking, with new discussion points coming in quite fast.
23rd September 2017: agreed new semester dates for a pilot with 4 faculties
2nd October 2017: successfully concluded test simulation on team of domain experts in a leading global service company and launched "expert" poll. Opinions were solicited by invitation to known, seasoned explorers, who responded to the simulation under identical conditions - same information with no requested bias.
6th October 2017: One week ahead of schedule, achieved target of 50 expert opinions for the data room simulation.
13th October 2017: complete first milestone for harvesting of expert control population - First tranche 74 submission, with sufficient sample size to see trends in 4 peer groups. The harvesting will continue until 150 verified experts have made contributions (estimated completion mid November). Preliminary results below (stages 50 and 101).
24th October 2017: broke through the 100 barrier and climbing towards the sample target.
9th November 2017: campus event 1 - PESGB Liverpool evening lecture (click here for abstract). The event attracted around 40 participants, 35 of whom were able to submit contributions, adding valuable information for future analysis. There was a good spread of experiences in attendance (6 first year undergrads, 2 second years, 11 final years plus 9 postgrads, 3 academic staff and 4 PESGB members from outside the faculty).

When invited to submit in a word what it is that they believed potential employers were looking for in them, they created the word cloud opposite. Clearly knowledge, experience and confidence came out very strongly – but there are other important elements captured that include skills, creativity, enthusiasm and positivity. An encouraging upbeat response.
Liverpool responses to the plenary session held over the space of an hour, which included a petroleum exploration primer so that all those in the room started with the same understanding of what an exploration opportunity looks like in a frontier setting and what the critical success factors ar:.

Geo-commercial vs geo-technical scores on a background of traffic light class limits defined by the KRACQS™ metadatabase, where the size of the bubble is determined by the total score, the colour by years of experience and the colour of the halo by the gut-feeling claimed by the contributor. The level of optimism is also calculated by class limits where the mid or neutral score is termed "undifferentiated" or safe and varies from degrees of bullishness (opportunistic, risky or reckless) to degrees of risk aversion (cautious or critical). Whereas "critical" implies that the opportunity is fatally flawed, undifferentiated votes suggest that the contributors could go either way. Polarised views (cautious or opportunistic) favour declining or participating in an opportunity respectively. The top pie chart depicts calculated moods, the bottom pie the number of participants by role. Inaccurate entries have missing scores; unrealistic entries are entries that conflict with reality.
20th November 2017: crowd-source O&G industry experience launched - Achieved target of 150 experienced geoscientists expert opinions from the simulated data room.
30th November 2017: campus event 2 - Royal Holloway -the event was a compressed version of the Liverpool event aimed at those familiar with what makes petroleum systems work. The event was supported in collaboration with Graeme Bagley, who strengthened recruitment content at the event, which was very much welcomed by the students. The event was not particularly well attended, as there was a clash with MSc exams - 8 postgrads and 1academic staff participated.

RHUL participants were invited to submit in a word what it is that they believed potential employers were looking for in them, resulting in the word cloud opposite. Clearly adaptability, skills and knowledge came on top – but there are other important elements captured like passion, motivation, social skills and potential.
Royal Holloway responses to the plenary session held over the space of 30 minutes, aimed at Petroleum Geology MSc student familiar with petroleum systems analysis.

Geo-commercial vs geo-technical scores on a background of traffic light class limits defined by the KRACQS™ metadatabase, where the size of the bubble is determined by the total score, the colour by Discipline and the colour of the halo by the gut-feeling for the opportunity claimed by the contributor. The level of optimism is also calculated by class limits where the mid or neutral score is termed "undifferentiated" or safe and varies from degrees of bullishness (opportunistic, risky or reckless) to degrees of risk aversion (cautious or critical). Whereas "critical" implies that the opportunity is fatally flawed, undifferentiated votes suggest that the contributors could go either way. Polarised views (cautious or opportunistic) favour declining or participating in an opportunity respectively. The top pie chart depicts calculated moods, the bottom pie the number of participants by role. Inaccurate entries have missing scores; unrealistic entries are entries that conflict with reality.
Some preliminary results
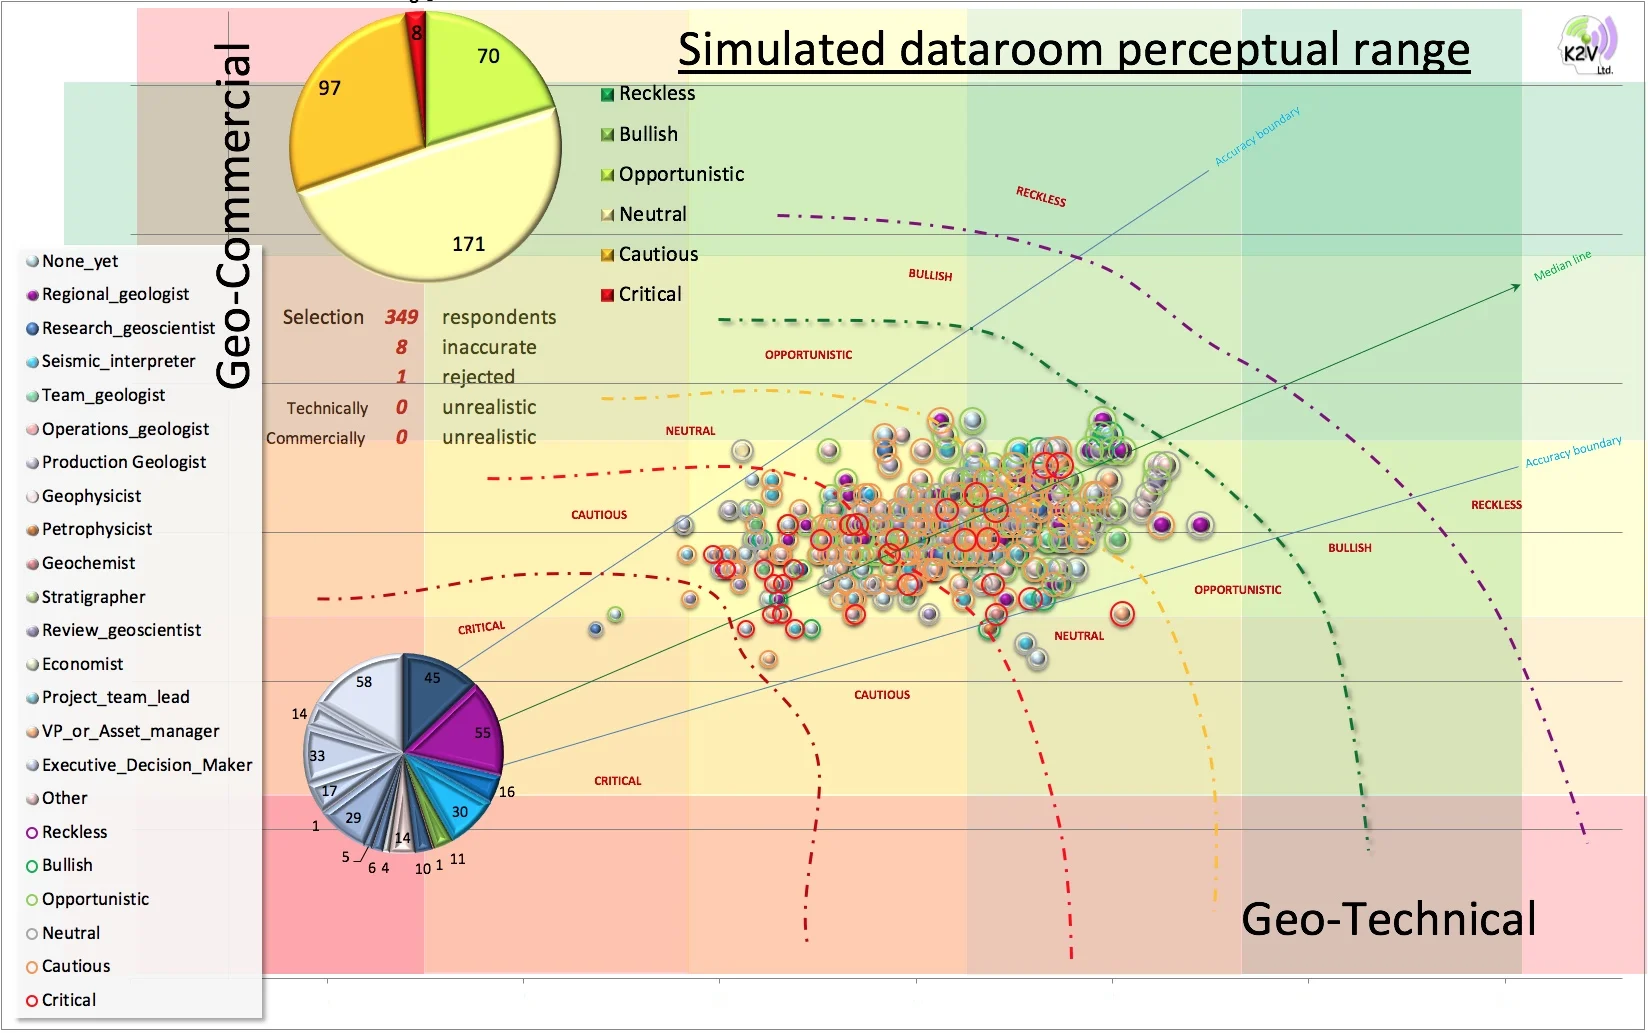
5th December 2017: A group of recognised experts in their fields were invited to participate in calibrating the simulation. The responses have now all but concluded with a current total of 161 participants. This represents a good sample to compare with the plenary sessions held at universities around the UK and the crowd-sourced responses obtained online. That is where the current focus will now switch. The crowd responses are summarised below:
Whereas it its technically possible for respondents to have their observational scores extend in to the Reckless, Risky or Critical sectors, our experts resisted the temptation to over extend their observations and remain largely conservative, with almost 50% scoring in the undifferentiated "safe" zone but with more than half the remainder being cautious, with some notable optimists also out there. The distribution is very spread and shows little overall bias. Where it gets interesting is how different peer groups (reporting from different functions in role) see the opportunity. The spread of respondents is not, however, as even as it could be, with the majority of respondents being regional geologists, with few specialists. K2V will attempt to shore up the gaps but the emphasis will be placed going forward on getting the opinion of less experienced and in particular those with little or no content knowledge. The meta data collected represents discrete (deterministic) opinions, which together for a distribution. The shoe of that distribution will evolve as the responses come in. What you see here is unfiltered.

Geo-commercial vs geo-technical scores on a background of traffic light class limits defined by the KRACQS™ metadatabase, where the size of the bubble is determined by the total score, the colour by the "Function in Role" and the colour of the halo by the gut-feeling for the opportunity claimed by the contributor. The level of optimism is also calculated by class limits where the mid or neutral score is termed "undifferentiated" or safe and varies from degrees of bullishness (opportunistic, risky or reckless) to degrees of risk aversion (cautious or critical). Whereas "critical" implies that the opportunity is fatally flawed, undifferentiated votes suggest that the contributors could go either way. Polarised views (cautious or opportunistic) favour declining or participating in an opportunity respectively. The top pie chart depicts calculated moods, the bottom pie the number of participants by role. Inaccurate entries have missing scores; unrealistic entries are entries that conflict with reality.
December 8th 2017: hit a milestone of 50 respondents to the crowd-sourced (online) survey. As this was launched on the 20th of November, that represents an participation rate of 2-3 per day, which is not bad. The hit rate is fuelled by posting on LinkedIn, with a small degree of "word-of-mouth". The latter needs to be improved on.
18th January 2018: PESGB, Henley (event) - The evening lecture at Henley was the first event of 2018, which constituted the same data room simulation as previous events but with a group of around 30 more experienced participants. Sadly, not everyone came equipped with smart devices but enough to make the event both useful and revealing.

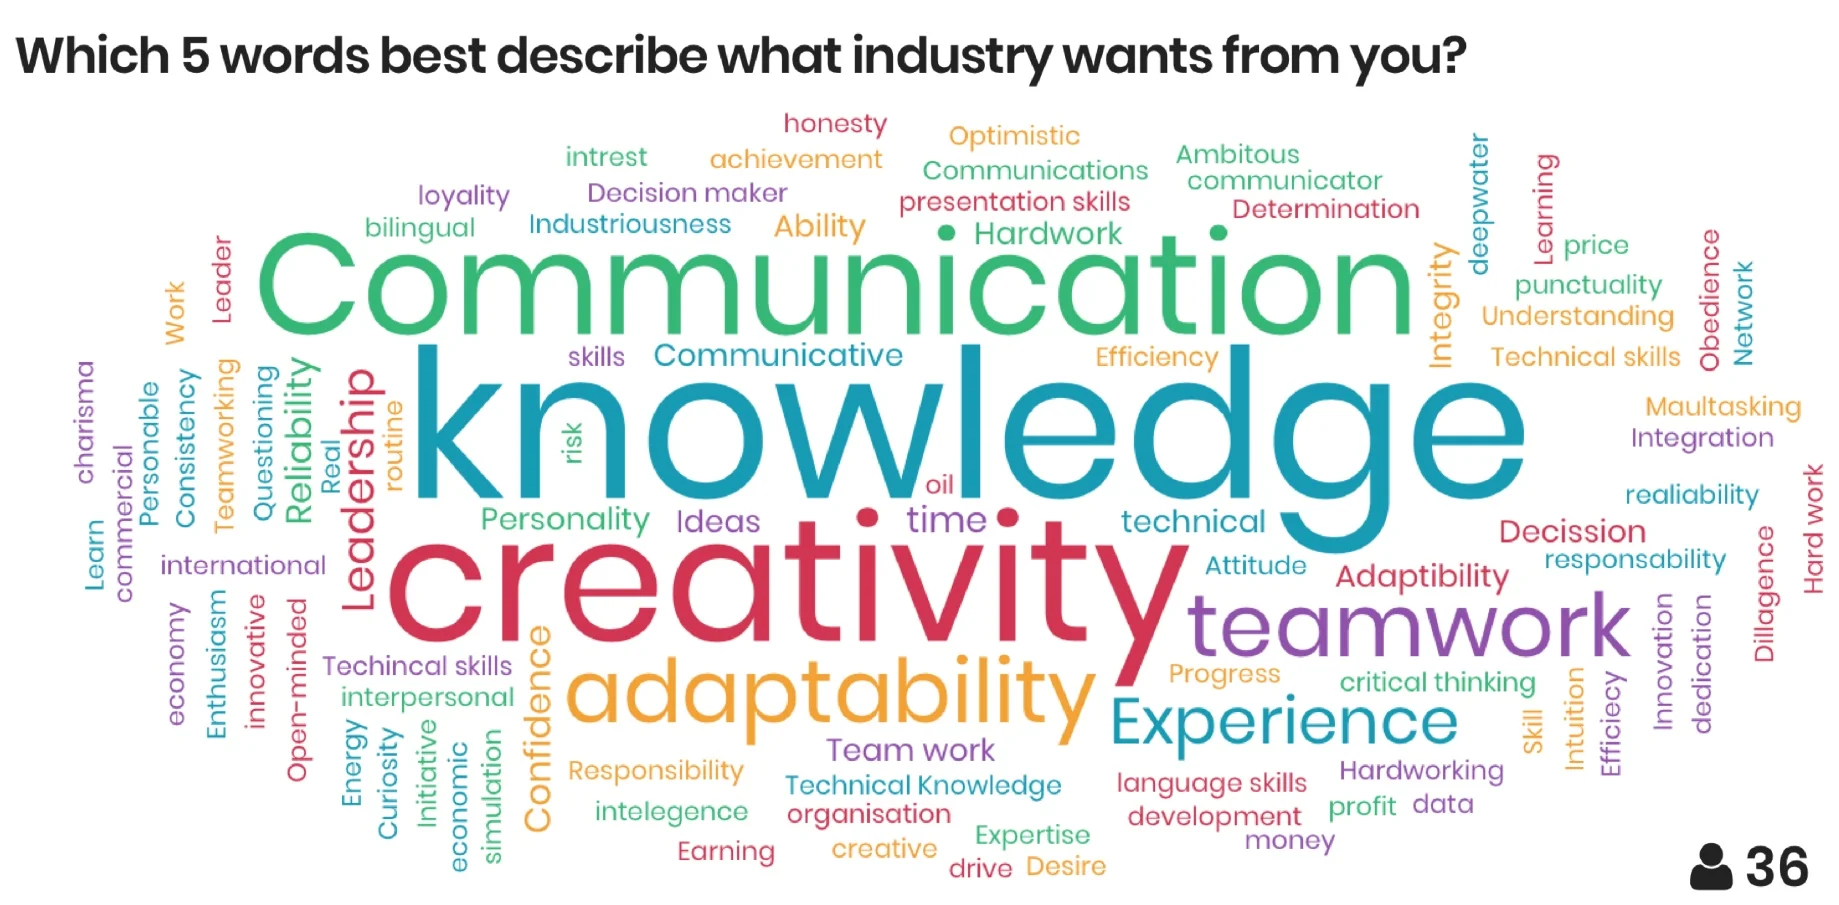
PESGB participants were invited to submit in a word what it is that they believed potential employers were looking for in them, resulting in the word cloud opposite. Clearly knowledge and experience came on top – but there are other important elements captured like innovation, adaptability and insights.
The Henley session definitely had its technical challenges: in the absence of wifi, we had to rely on a mobile facilitated hotspot. 16 of the 25 participants who had smart devices were able to submit their entries. The spread is quite different from other venues inasmuch 85% felt able to polarise risk, with almost 70% scoring as "cautious". In effect, Henley showed a bias, attributable either to the pitch (anchoring) or to special insights particular to Henley. The third reason (the free flow of beer during the event) was rejected as a source of bias.
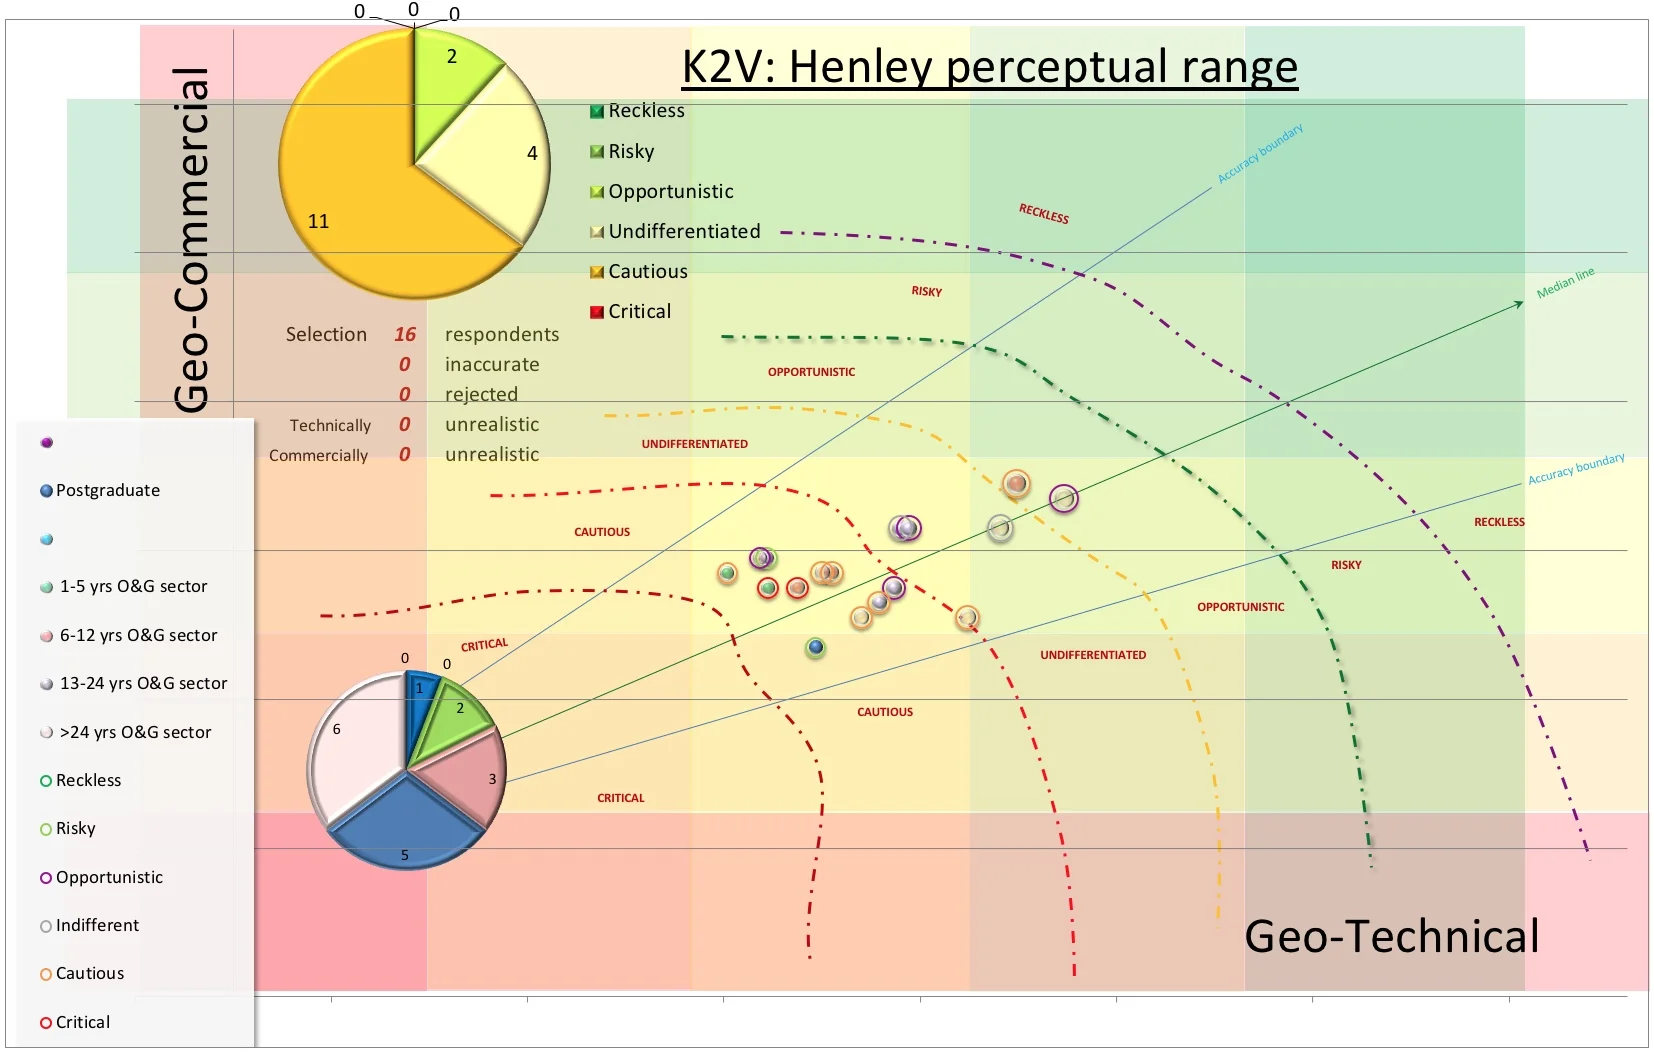
Geo-commercial vs geo-technical observational scores on a traffic light background of class limits defined by the KRACQS™ metadatabase, where the size of the bubble is determined by the total score, the colour by the years of industry experience and the colour of the halo by the gut-feeling for the opportunity claimed by the contributor. The level of optimism is also calculated by class limits where the mid or neutral score is termed "undifferentiated" or safe and varies from degrees of bullishness (opportunistic, risky or reckless) to degrees of risk aversion (cautious or critical). Whereas "critical" implies that the opportunity is fatally flawed, undifferentiated votes suggest that the contributors could go either way. Polarised views (cautious or opportunistic) favour declining or participating in an opportunity respectively. The top pie chart depicts calculated moods, the bottom pie the number of participants by role. Inaccurate entries have missing scores; unrealistic entries are entries that conflict with reality.
5th February 2018: Today, a total of 300 people responded to the survey, contributing at least 10 minutes of their time to the experiment on collapsing cognitive bias with an excellent spread of "functions in role". Our thanks have been extended to all of you (click HERE).
The majority of respondents are regional geologists (55), closely followed by students (46). Vice President of companies or asset managers constitute a healthy 32 respondents with executive decision makers adding another 14. Seismic interpreters consist of 28 contributors, closely followed by Review geoscientists (27) and project team leaders (17). Healthy but low numbers of contributions come from research (12) and production (10) geoscientists, with 11 geophysicists and 10 team geologists. Bringing up the rear are specialist contributions from geochemists (5), stratigraphers (5), petrophysicists (4) and just 1 economist. 23 others contributed but felt they didn't fall in to any of the "functions in role" listed above.
Each of the peer groups have slightly different tendencies, which are starting to emerge in the data and which will be interesting to analyse when all the results are in.
23rd March 2018: Aberdeen University (event) - A midday event was held at the University of Aberdeen, attracting 36 postgraduates and staff. As before, they were invited to submit their thoughts on what characteristics industry seeks most from them, with the emphasis as before on Knowledge but with strong emphases on creativity, communication skills, team work and adaptability not seen before. The IT didn't go quite as smoothly as it has done in the past but if created a new insight that hadn't been picked up. The system stalled after about 8 minutes, when one third of the respondents had already submitted their responses. They all plotted in the undifferentiated "safe" zone. When the system was back online (apart from losing a couple of responses), the remaining more contemplative responders assumed the normal, more polarised distribution witnessed in past events. It remains to be seen if this trend is repeatable.

Geo-commercial vs geo-technical observational scores on a traffic light background of class limits defined by the KRACQS™ metadatabase, where the size of the bubble is determined by the total score, the colour by expertise and the colour of the halo by the gut-feeling for the opportunity claimed by the contributor. The level of optimism is also calculated by class limits where the mid or neutral score is termed "undifferentiated" or safe and varies from degrees of bullishness (opportunistic, risky or reckless) to degrees of risk aversion (cautious or critical). Whereas "critical" implies that the opportunity is fatally flawed, undifferentiated votes suggest that the contributors could go either way. Polarised views (cautious or opportunistic) favour declining or participating in an opportunity respectively. The top pie chart depicts calculated moods, the bottom pie the number of participants by role. Inaccurate entries have missing scores; unrealistic entries are entries that conflict with reality.
June 1st 2018: As an intermediate assessment, some early observations are now coming out. We are still short of a statistically valid population but individual scores have been measured against technical expertise and levels of experience, then compared with the actual outcome based upon a real opportunity. Different disciplines are tending to demonstrate different biases but on the whole, the range of observational outcomes were strikingly consistent. Half of those who plotted in the neutral “safe” zone did so because they had insufficient information to polarise their view. Those who polarised their views were more prepared to tap in to their experience to overcome the gaps in information (exercising judgment) and often did so robustly but never exceeded the boundaries of possibility. What is less easy to explain is the disparity between how people reported their mood in conducting the survey and how their observational scores plotted. For instance, some people claimed that they felt “bullish” when doing the survey but their observational scores demonstrated that they were being “cautious”. The work has demonstrated that crowd-sourced opinion solicited in this way delivers results that are both rational and measurable. But there are many unanswered questions such as the gap between intuitive “gut feel” and their more analytical observations.
November 27th 2018: A presentation was made at PETEX to introduce the importance of sharing knowledge as part of the process of of rejuvenating tired but prolific petroleum systems such as the North Sea. The initiative to tour faculties with a data room simulation to establish if independent crowd-sourced opinion was capable of providing the means to mathematically collapse cognitive bias in support of decision making was described. The challenge was to establish what size of population is needed to achieve a statistically valid result. Participants were supplied with an information pack of three summary slides containing commercial background, play and prospect information, and were invited to role play. As with every data room, there were both gaps in information and an oversupply of detail in some areas. Participants were asked to indicate whether they would elect to participate in an opportunity (i.e. judgment or “gut feel”) and their responses were compared with a calculated value derived from 20 geo-technical and geo-commercial metrics (i.e.powers of observation). Where individuals plot below is still a guess but it is more accountable than the overall judgment because it is under-pinned by premises that we recognise. In effect, we establish the credibility of the whole by summing its parts and then comparing the two as separate perspectives to examine the differences (calibration).
Despite the complexity of informational challenges presented to participants in live sessions, it took them no more than 10-15 minutes to complete their observational scores, which appeared live on the presentation screen as they submitted their responses. Individual scores were measured against technical expertise and levels of experience, then compared with the actual outcome based upon a real opportunity. Different disciplines tended to demonstrate different biases but on the whole, the range of observational outcomes were strikingly consistent. Half of those who plotted in the neutral “safe” zone did so because they had insufficient information to polarise their view. Those who polarised their views were more prepared to tap in to their experience to overcome the gaps in information (exercising judgment) and often did so robustly but never exceeded the boundaries of possibility. What is less easy to explain is the disparity between how people reported their mood in conducting the survey and how their observational scores plotted. For instance, some people claimed that they felt “bullish” when doing the survey but their observational scores demonstrated that they were being “cautious”. The work has demonstrated that crowd-sourced opinion solicited in this way delivers results that are both rational and measurable. But there are many unanswered questions such as the gap between intuitive “gut feel” and their more analytical observations.
March 6th, 2019: Plenary session with the AAPG chapter at the Royal School of Mines (Imperial College) under the sage guidance of Professor Gary Hampson.
March 15th, 2019: Return visit to Aberdeen, organised by Professor John Howell and David Iacopini. Excellent turn out and some interesting comparisons between 2018 and 2019.
March 26th, 2019: Posted initial results, with a short article on LinkedIn (HERE) as an abbreviated of a more complete article (HERE).
April 2nd, 2019: First session at Manchester, organised by Professor Redfearn - the participants were mostly MSc. Petroleum Geology students, who had quite a strong inclination towards favouring the opportunity but were quite cautious of their own observations.
April 30th, 2019: Launched corporate invitation to participate with the realisation that the biases seen have the potential to create systematic errors in portfolios that are both detectable and correctable.
May 1st, 2019: CDT close out at Manchester included a simulated data room and a careers advisory section
May 11th, 2019: Double session at Heriot Watt to cover both the simulated data room and the career health checker.
TOTAL NUMBER OF RESPONDENTS UP TO THIS WEEK IS 480
COMING UP
October 31st - Close out of experiment.