Stacking Knowledge - the RESULTS
5th November, 2019

An experiment was launched in 2017 to see if “stacking* knowledge” can support decision making in the oil & gas sector. The experiment featured a mock dataroom for a single hybrid frontier opportunity, which closed on the 31st October 2019**. Repeated simulations captured a broad range of opinion using a questionnaire in both live plenary sessions as well as individually online. Each participant provided one of five multiple choice responses to twenty value metrics derived from the information provided, which were combined to assemble heuristics on relative value for the opportunity. These were then compared with various demographic groups to test if there were any detectable voting trends between levels of experience, discipline, perspective and outlook.
The current article briefly summarises the outcome of this work, without discussion or conclusions. The results confirm the existing theories on "the wisdom of the crowd", for the first time here amongst geoscientists. The results also identify quite specific bias; what is new is that both are measurable and can be clearly visualised in a one-hour plenary session through the graphics presented below.
It is fair to say that the experiment started out with certain expectations (harvesting knowledge in support of decision making), which have changed over the course of the last two years, with some very humbling lessons along the way. What has emerged is the identification of a "perceptual gap", which was quite unexpected; finding out if such a perceptual gap has any meaning is still continuing but it has already been used by some companies to map the range of outlooks in their organisations.
INTRODUCTION
There have been a number of initiatives in the last few years to crowd-source opinion in the oil & gas sector, to gauge opinion on real opportunities (e.g. Draupner Energy) and to improve success rates on future opportunities by examining historical success, acknowledging that luck plays an important role, particularly in frontier settings [1,2]. Other studies, many proprietary, have independently found that the oil & gas sector is good at enumerating risk but bad at scoping uncertainty.
Making predictions about deceptively simple binary outcomes (e.g. “Are commercial hydrocarbons present – YES or NO?”) are usually underpinned by complex forecasting with large uncertainty ranges created by absences in data, knowledge and/or understanding, which in exploration we call white space [3]. In 1906, Francis Galton (a pioneering statistician) had something more entertaining in mind when he stumbled across a weight betting competition at a village fair. 787 butchers, farmers, milkmaids and cow hands, all tried their luck (independently) guessing the weight of a fine Ox. The crowd had access to exactly the same information (what they could see) but conceivably, some had more relevant content-knowledge than others. All imagined that they had a fair crack at winning the prize money (overconfidence).
After the prizes had been handed out, and everyone had packed up and gone home, Galton compiled their guesses, which unsurprisingly followed a Gaussian bell-curve. The mean came out as 1,197 pounds; the Ox’s actual weight was 1,198 pounds [4]. Much to his annoyance, Galton had validated the “wisdom of the crowd”. Could such an approach be used in support of decision-making for the oil & gas industry and change the way we do business now that we have the means to harvest opinion?
But why should anyone believe that collective intelligence based on individual ignorance can in any way be equal to, let alone surpass, expert opinion?
The experiment on stacking knowledge was launched to establish if the crowd could estimate the attractiveness of an opportunity in support of decision making in the oil & gas sector, by stacking opinions based on the complex metrics underpinning value [5].
METHOD
Guessing the weight of an ox is no less an achievement than guessing the height of a hydrocarbon column but the presence of the ox is indisputable. In the oil & gas sector, the presence of a hydrocarbon column is risked. The remaining success cases (that there is a hydrocarbon column) arguably contains the same uncertainty as guessing the weight of an ox. It is now just a question of size. Guessing size also contains risk (in 1906, the exposure was sixpence per guess) but decision makers find it relatively easy to take a punt on risk; what they can’t handle is uncertainty because uncertainty enforces a range. If you are going to invest a sum of money on a single outcome, whether it is sixpence of six million dollars, that investment is never a range even though it is only based on an estimate. The estimate is a fixed risked expectation that is predicated on a single deterministic outcome, forcing polarisation, effectively collapsing uncertainty in the full knowledge that, for one opportunity at least, it is wrong. This creates what is normally a constructive tension between decision makers and their technical and commercial advisors. But the outcome typically relies on the testimony of relatively few opinions, potentially restricted by their lack of diversity in thinking or worse, distorted by unconscious cognitive bias.
Over the last two years, K2V Ltd has been attempting to emulate Galton’s discovery by applying the same principles to the oil & gas sector using crowd-sourced opinion in a simulated dataroom of a frontier exploration prospect [5]. Just like the village fair, participants with diverse content-knowledge were invited to offer independent guesses from the same information, but that is where the similarity ends. Conducting a sweepstake on size was never going to support an investment decision on its own, partly because of the complexity of overlapping hypotheses, and partly because exploration white-space is too large and too incoherent to make meaningful (informed) guesses, and those only in the success case. Instead, 485 geoscientists, asset managers, commercial leaders and students tried their luck guessing whether the opportunity was worth taking a punt on by self-reporting their gut-feeling (mood) on risked value for the opportunity. What is new, perhaps even radical about this experiment, is that participants were simultaneously quizzed on the deconstructed component elements of risked value, taking participants back to the evidence underpinning their observations [6]. The deconstructed elements, were then reconstructed (stacked*) to a new aggregate value on the same scale of optimism as their mood, revealing two different modes of thinking [7]. Their mood engages participants’ optimism for the opportunity, their stacked observation reveals their objective evidence-based predictions on the same scale [8].
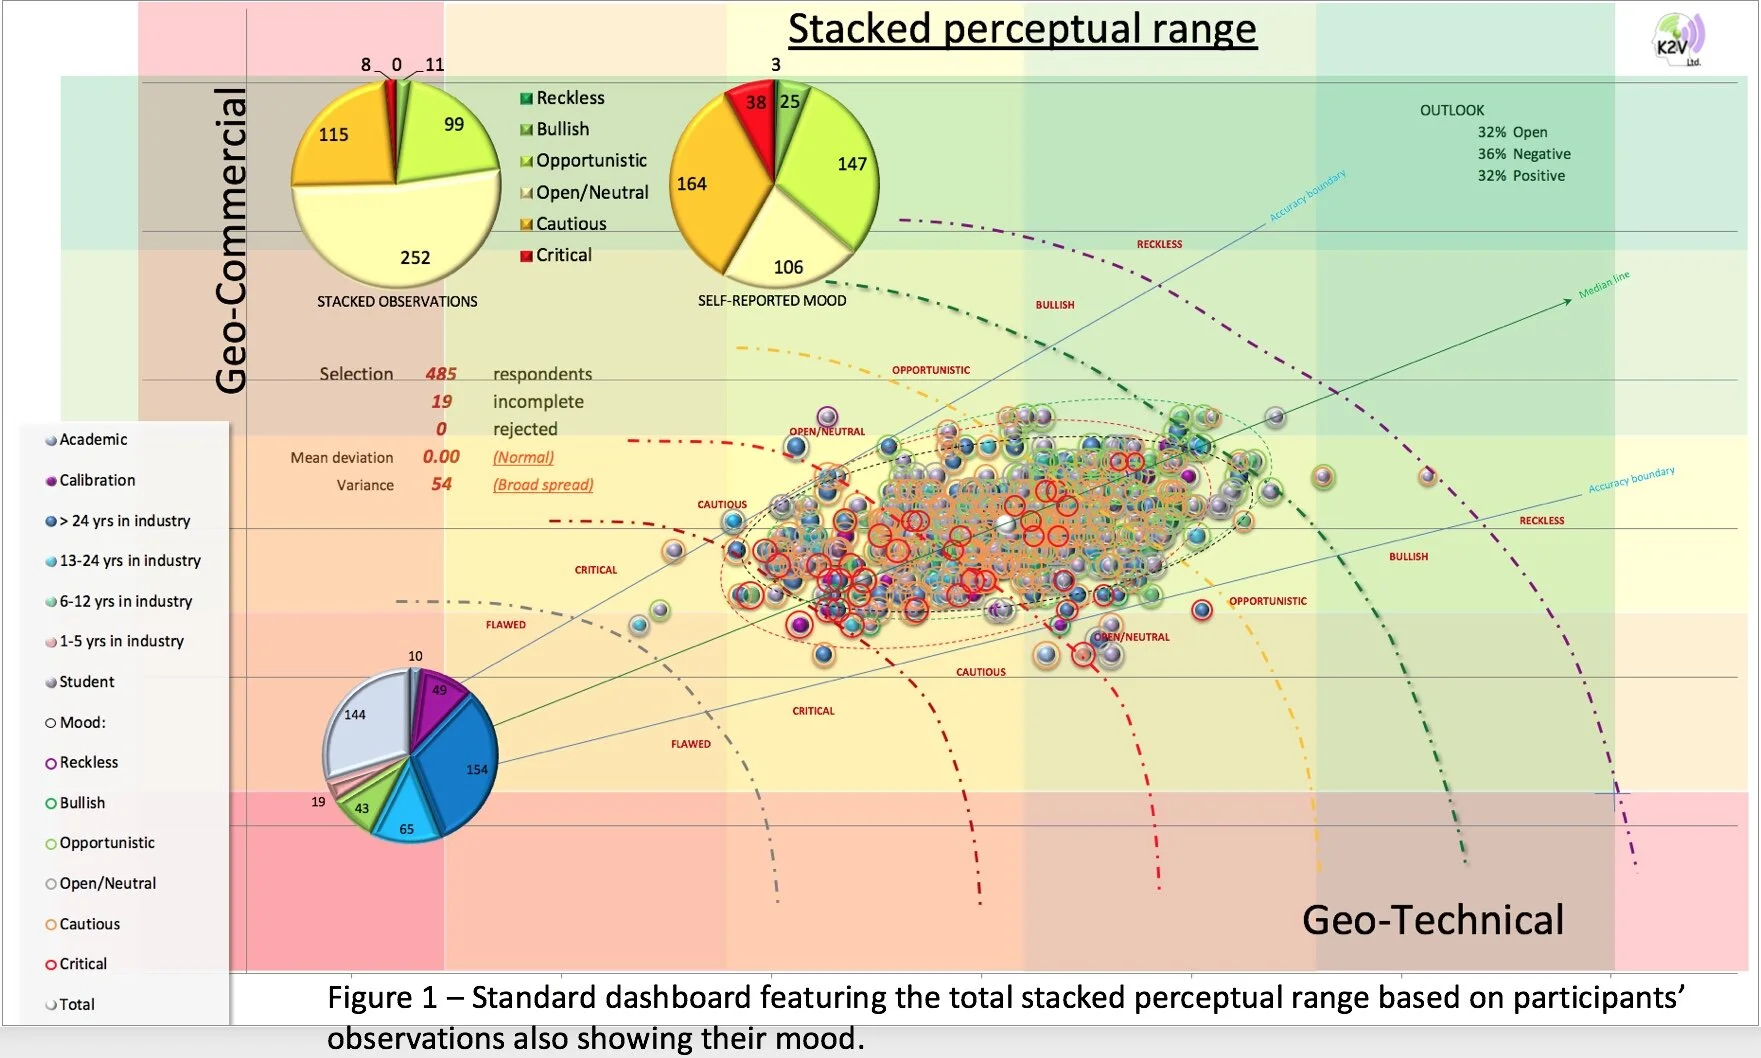
The perceptual range plot in Figure 1 is the standard “dashboard” for the experiment, which shows geo-commercial versus geo-technical axes on a scale of optimism, subjectively class limited in to critical, cautious, neutral, opportunistic, bullish and reckless. The “bubbles” plot on the scale by summing the total geo-technical and geo-commercial scores stacked from evidence-based metrics. During live plenary sessions, the dashboard is projected on the screen so that respondents can see their own bubbles appearing when they pressed “submit” on their smart devices. To everyone else, the bubbles are anonymous (only individuals know when they press submit). The colour of each bubble is determined by level of experience, with the colour of the “halos” by the respondents’ self-reported mood for the opportunity. The two pie charts top left shows the two modes of thinking, contrasting the proportion of stacked observations (left) with mood (right). Note that the distinction between classes is notional as the points are stacked as a continuum, with geo-technical priority below the medial line and geo-commercial priority above it.
At the heart of the experiment are the testaments of 485 participants, who submitted their opinions through seven geo-commercial metrics and ten geo-technical. The total scores from each participant express different perceptions of value, which are all based on common knowledge: shared information given equally to all participants. Individuals' perceptions contrast in the way that the information is received through the lenses of their experience in years, in expertise and in perspective, such that no two opinions are the same.
RESULTS
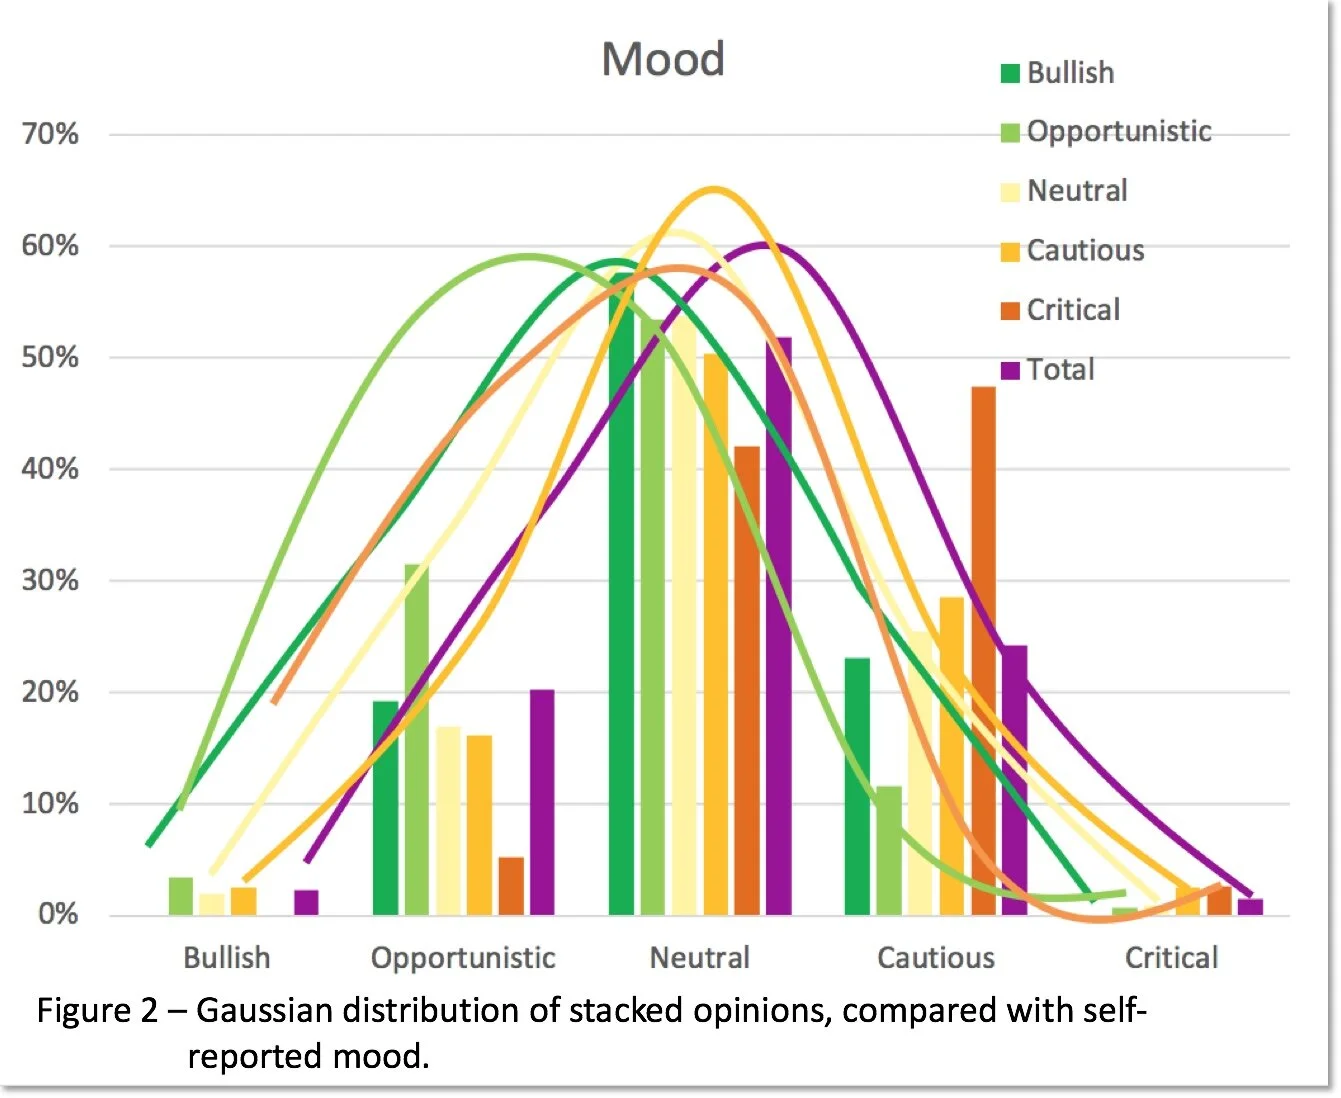
K2V has collected 9,700 discrete opinions as hard data supplied by 485 independent professionals and students of the oil & gas sector. With the results now in, the class limits plotted in the dashboard in Figure 1 from participants’ stacked opinions were re-calibrated around the aggregate total average (white bubble) as the mid-point of the “open” class. Opinions cluster around the average and extend out elliptically as might be expected for Gaussian distributions (figure 2). Three dotted ellipses outline the spreads of opinion representing open (black), optimistic (green) and pessimistic (red) moods. In effect, the ellipses encompass the extent of commonly held perceptions and can be sketched for any peer group. Any individual whose bubble falls outside of the ellipse is a person of interest, with the capacity to erode or create value. Those who think outside the ellipse can be mistaken or they may know something that others do not know about the opportunity. Either way, they are worth having a conversation with to support the right decision.
The distribution of stacked opinions is Gaussian (figure 2) but each peer group displays differences in average (mean) and total spread (variance).
Table 1 lists the divergence in the total sample sizes, means (mean deviation) and variance for different levels of experience (blue), different expertise (green) and different perspectives (orange). Where experience is concerned, there is some drift in the mean for different levels of experience but the spread of opinion and their means are not large or coherent.
A slightly different picture emerges when areas of expertise are compared, partly because the sample sizes are smaller. Nonetheless, the spread of opinion is exceptionally tight for geochemists, commercial experts as well as production geologists and petrophysicists, which has consequences (see cognitive bias).
Participants were also asked what they based their organisational point-of-view (PoV) on. The largest spread came from National Oil Companies as well as major and mid-cap Independent Oil Companies (IOC), and investment companies but the means are consistent between all business perspectives.
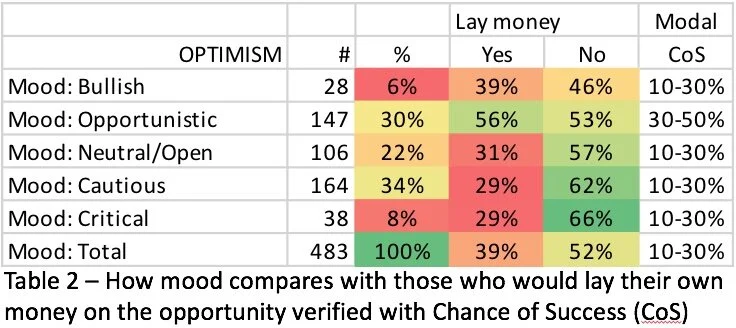
The results in Table 1 were derived from stacked observations but participants were also invited to self-report their mood by stating what their “gut-feeling” was for the opportunity on a scale of optimism centred on “Open”. The self-reporting mood is “loaded” because, having invested some time to read the material and answer the questions, fewer participants would admit to being neutral about it. It forces polarisation so that 78% of participants indicated that were inclined to be either optimistic about the opportunity or pessimistic about it (with a slight emphasis on pessimistic - below). They were also asked whether they would lay their own money on the opportunity, which most declined (61%). It is worth pointing out here that the difference between those who felt “opportunistic” and “bullish about the opportunity makes no sense and may be an error created by differences in the interpretation of “bullish” vs “opportunistic” from the questionnaire.
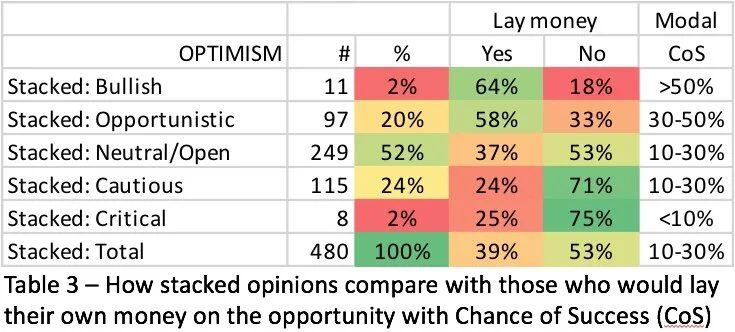
The stacked observations of participants are not self-reported but calculated from participants’ observations of the evidence with no forced polarisation and arguably present a more generalised distribution. This time, less than half (48%) of participants indicated that were either optimistic about the opportunity or pessimistic about it (also with a slight emphasis on pessimistic - below). The distribution of those who consented to lay their money on the opportunity is arguably more rational than gut-feeling, which is also more consistent on estimates for chances of success (CoS).
COGNITIVE BIAS
Participants were tasked with identifying which of the geo-technical elements they thought carried the greatest technical risk (charge, reservoir, seal, timing, trap or none of these as defined in the simulation). The coloured percentages in the table below shows how different experts in their field identified the weakest link in the petroleum system for the opportunity.
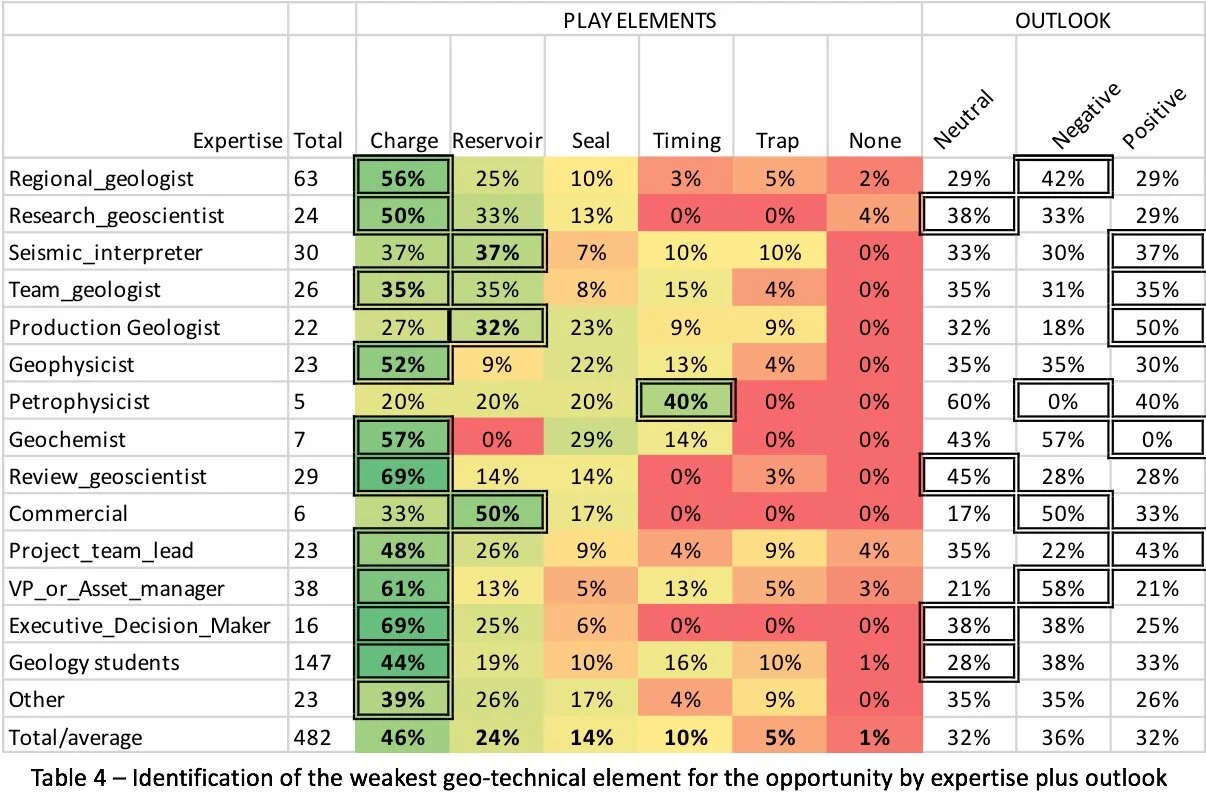
Review Geoscientist and Executive Decision Makers are the clearest about charge as the main technical concern for this opportunity. It might not surprise you to note that most reservoir engineers consider “reservoir” to be the greatest geo-technical risk, or that geochemists cite charge and commercial leaders consider non-technical risks more compelling. That is “availability bias” right there, but it turns out that there is another way to measure bias. The experiment accidentally uncovered a perceptual gap between participants' self-reported gut-feeling for the opportunity (mood) and what the evidence is actually telling them from their "stacked" observations. The perceptual gap reveals an internal conflict. One third of the participants experienced no such conflict, because their moods are the same as their stacked observations (called here “neutral”). The remaining two thirds are roughly evenly split between those whose moods are lower than their stacked observations (called here “negative”), and those whose are higher (called here “positive”). These are presented in the last three columns in the table above under “outlook”, presented graphically in the ternary plot in figure 3 opposite.
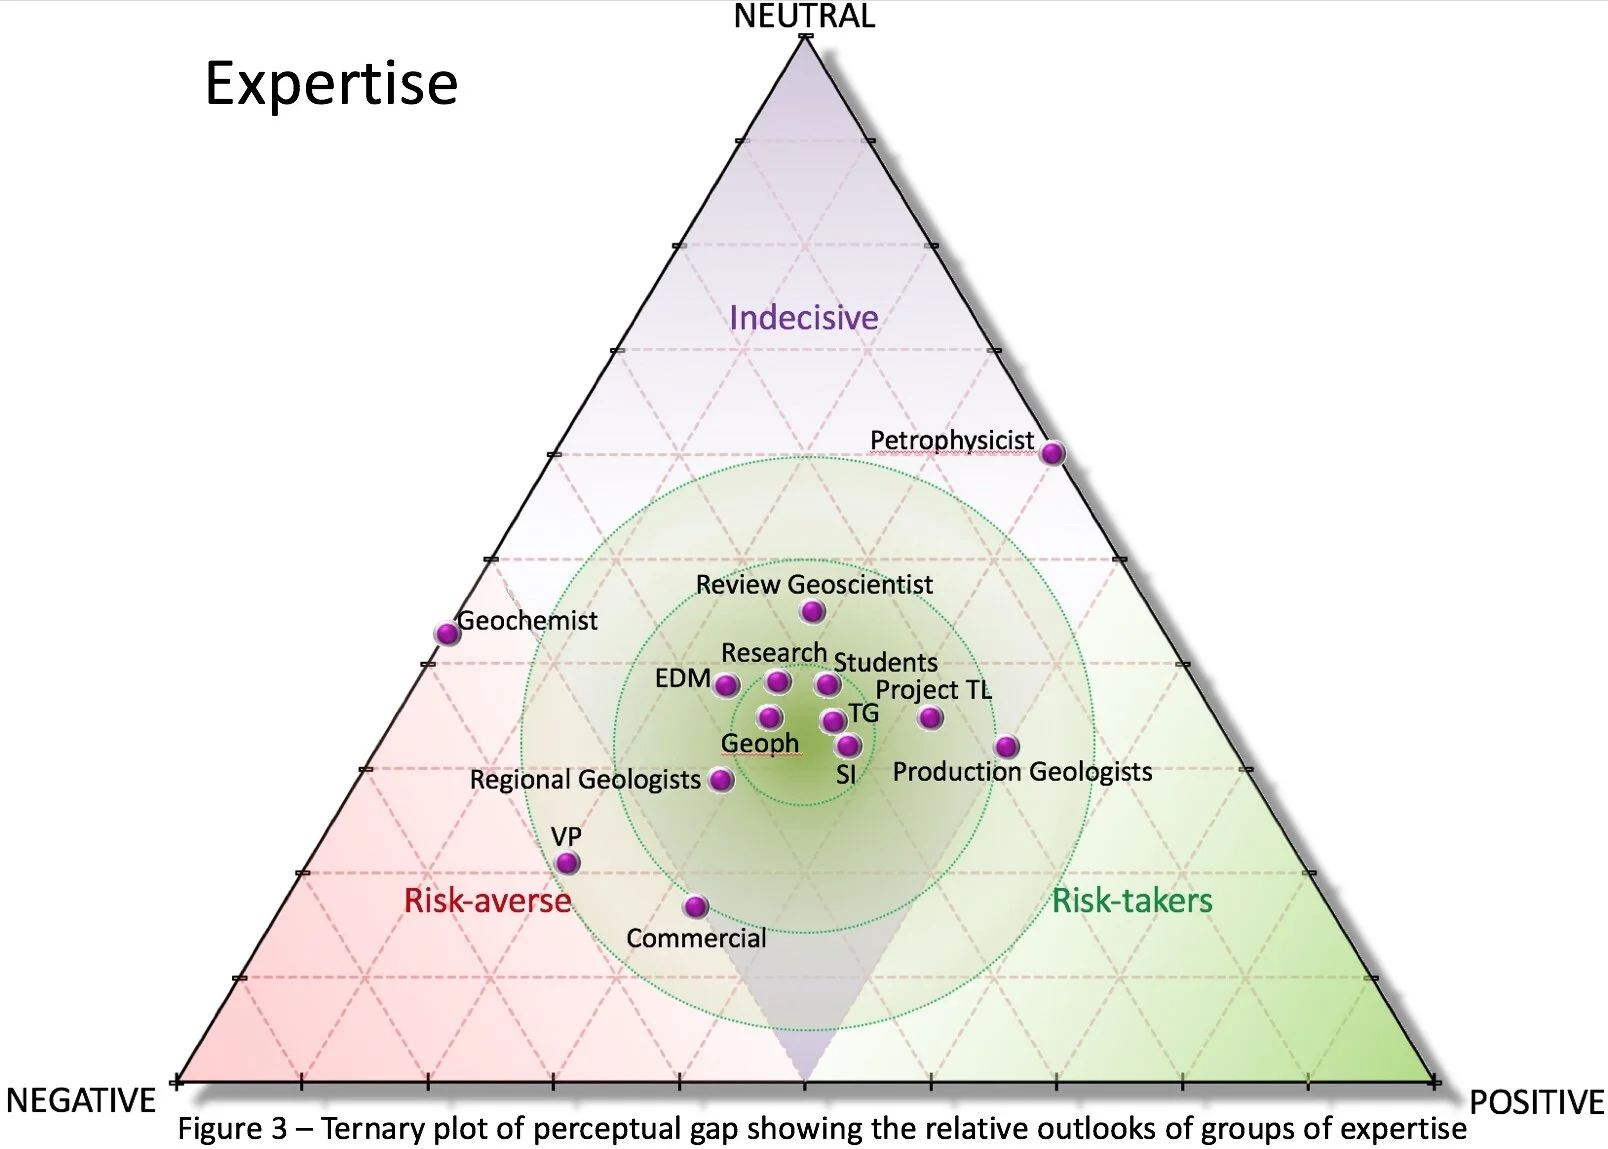
The central green bullseye represents the most balanced peer groups, where the number of individuals who are polarised positive or negative are the same as those who are neutral. Any departure from the central ring, therefore, represents an increased tendency towards combinations of the three axes, with Review Geoscientists being the most neutral or even-handed. The spread of opinion was previously reported as exceptionally tight for geochemists, commercial experts as well as production geologists and petrophysicists. All four plot well outside of the inner rings, with geochemists and petrophysicists strongly negatively and positively biased respectively. Vice Presidents are also showing a strong negative tendency, whereas Executive Decision makers are quite balanced tending towards neutral or even handed. What we are seeing here is that specialists have a tendency towards bias, whereas generalists are able to use judgment more effectively in making their choices. Does this mean that experts are not needed? Well – no, because they supply essential information to help generalists condition their view. The power of crowd-sourcing knowledge is including all opinions to achieve a decision, not excluding them. But doing so in a way that makes sense to the decision at hand.
Evidently the perceptual gap is easily measurable; though subjective, it is real. If indeed geochemists have a negative outlook because they doubt the robustness of the petroleum system and production geoscientists (dominated by reservoir engineers) see the reservoir as a given, these should show up clearly in their observations (figure 4).
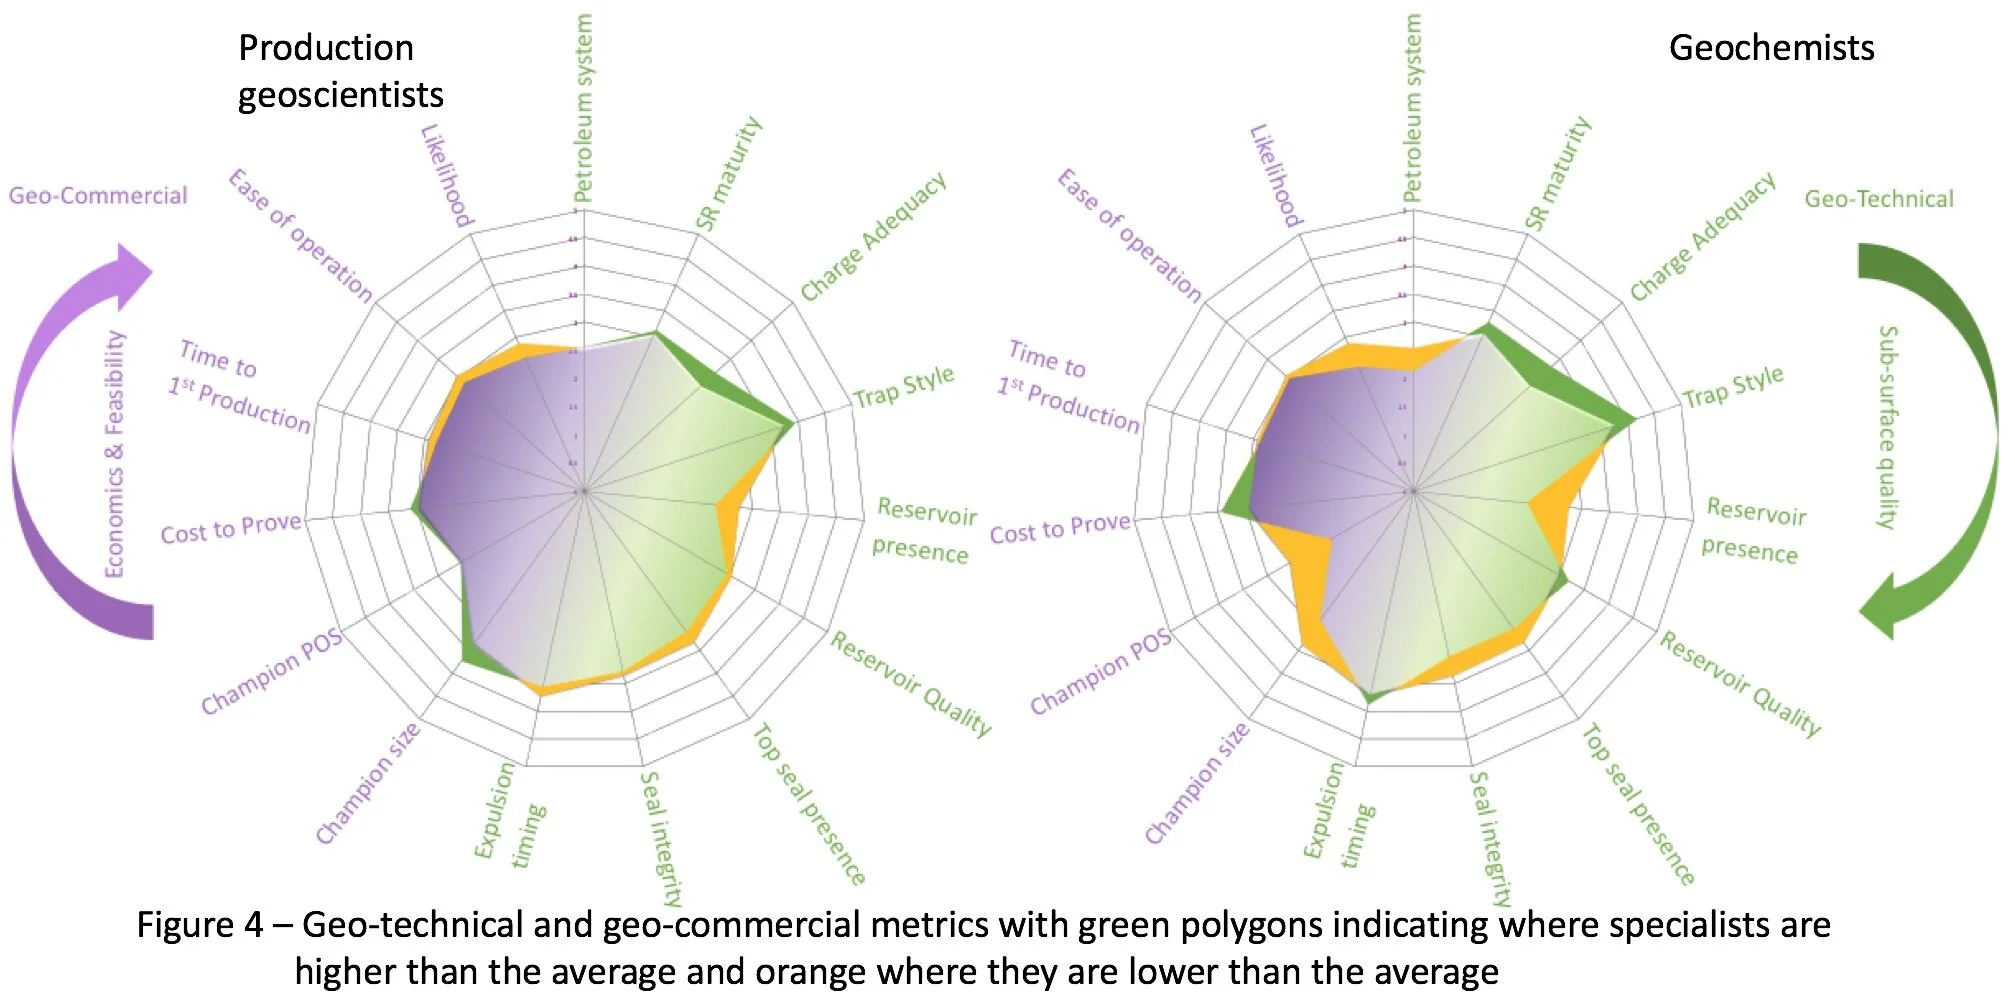
The radar plots above show the average geo-technical and geo-commercial metrics scored by participants along the reticle (scored 1-5 from centre to rim). Where the individual or control group scored more than the global average, the tip shows orange and where less, the tip shows green. The plots show that, whereas geochemists do doubt the petroleum system (orange tip), they do so in a measured way. Production geoscientists on the other hand challenge reservoir presence and quality and do not assume it is a given, the opposite of what might be expected given their positive outlook. More work needs to be done on this to establish what the data are showing us.
SUMMARY
HIGHLIGHTS
· Crowd-sourced opinion for an opportunity does converge on an average value of relative attractiveness for the opportunity
o Greater experience does not alter the spread of opinion but it does accelerate convergence to a stable mean
· There is arguably more to be gained from identifying individuals who think outside the cluster of common opinion than those who conform and contribute to it
o Those outside the cluster who know something that others do not know about the opportunity can be distinguished from those who are just mistaken with a simple conversation
o No-one knows what the right interpretation is, which could be in the middle of the cluster, but it also might be beyond what anyone dared to suggest, we just don’t know
· There is a measurable perceptual gap between participants’ gut-feeling for the opportunity (mood) and what the evidence is actually telling them (stacked)
o Two thirds of the participants disagree with what the evidence is telling them
o The perceptual gap is stronger for negative responses (172 vs 155) but positive responses are marginally more extreme
o Review geoscientists are well positioned to support decision making
· Geo-technical experts tend to demonstrate availability bias, where generalists tend to exercise judgment
· The experiment has delivered a calibrated tool capable of harvesting collective opinion to measure both relative attractiveness for opportunities and mitigating potential distortions arising from bias using a cost free inverse “Cold Eye Review” approach designed specifically for the oil & gas sector
· Total spread, convergence on the mean, degrees of optimism for mood and observations, as well as perceptual gap, group outlook and bias can all be seen live evolving on the dashboard as entries are submitted during plenary sessions
GENERAL OBSERVATIONS
· No two evidence-based opinions are the same (5 options across 20 metrics); everyone receives the information given to them differently
· Whether participants are willing to put their money on the opportunity is not uniformly associated with optimism
· The spread of opinion is similar across most demographic groups
o Some groups are more or less optimistic than others
· Approximately half of the participants’ stacked observations plot in the open zone based upon the evidence presented to them
o The remaining half are split between optimistic (opportunistic, bullish) and pessimistic (cautious or critical), with a slight emphasis on pessimistic for this opportunity
· The relative proportions of optimistic and pessimistic opinions are often similar between stacked observations and self-reported moods.Moods, however, are significantly more polarised than their observations
LOWLIGHTS
· A sweepstake approach to crowd-sourcing value in data poor frontier settings is probably not valid
· Self-reported moods that were “Bullish” or “Opportunistic” are not rational, suggesting an inconsistency in the way in which these two moods are interpreted by participants. If true, this invalidates any distinctions in mood between those two classes.
FOLLOW UP
The design of the questionnaire could be greatly improved with hindsight but it does represent a significant resource of raw data, which this article just scratches at. The data are open to anyone who would like to conduct their own tests or verify what has been written about them, with the names of individuals, companies and institutions removed. If you would like access (freely given by participants and by us), please email a request to info@k2vltd.com.
ACKNOWLEDGMENTS
The authors wish to acknowledge the contributions made by everyone who took the time to carefully respond to the survey in good faith, believing that some good may come of it. We would like to acknowledge the efforts made by the staff and students at Liverpool, Royal Holloway, Manchester, Aberdeen, Heriot Watt, Cardiff, Imperial College and Leeds and a number of companies and organisations who allowed their internally sourced results to be published, including the PESGB. We would particularly like to acknowledge the patience and guidance given by Steven Bloemendaal, Marc Bond, Allan Scardina, Paul Cleverly, Simon Neal, Graeme Bagley, Peter Burgess and Frank Glass.
*The process of deconstructing then reconstructing opinion created by K2V is called stacking, a term borrowed from seismic processing where offset viewpoints acquired at the surface are stacked to a common depth point as a single representation of the full collective range of offset views
**Plenary simulations will continue by request, from enriching conversations about risk-taking at universities to detecting bias within selected groups
REFERENCES:
[1] Richard Barrett, 2019 - Finding Oil and Gas - Luck or Judgement? [LinkedIn article, September 2019 - https://www.linkedin.com/pulse/ding-oil-gas-luck-judgement-richard-barrett/]
[2] Alexei V. Milkov and William C. Navidi, 2019 - Randomness, serendipity and luck in petroleum exploration [AAPG pre-print, 2019]
[3] Guy Loftus, Allan Scardina, Peter Burgess and Simon Neal, 2018 – Thinking Outside the Play [GeoExPro Magazine, Vol 15, No. 5-2018 pp34-36]
[4] Surowiecki, J, 2005, The Wisdom of the Crowds [Anchor Books ISBN 978-0-385-72170-7]
[5] Guy Loftus and Marc Bond, 2019 - On the experiment to COLLAPSE COGNITIVE BIAS (in support of decision making) [LinkedIn article, March 2019 - https://lnkd.in/eThTY8G]
[6] Sweepstake Knowledge: the tyranny of orphaned deterministic numbers {K2V article, 2018 - www.k2vltd.com/article-8]
[7] Knowledge Stacking: a crowd in search of the truth[www.k2vltd.com/article-6]
[8] On the experiment to COLLAPSE COGNITIVE BIAS (in support of decision making in the oil & gas sector)[www.k2vltd.com/article-22]