CROWD-SOURCED FRONTIER PROSPECT EVALUATION: last chance to vote!
17th September, 2019

Over the last two years, K2V has been crowd-sourcing opinion using a simulated dataroom on a frontier prospect in the oil & gas sector: we probably now have enough responses to publish the results. But not before you have had a final chance to offer your opinion (if you haven’t done so already) before the end of October; this is your last chance to vote!
All the opinions harvested in this survey have been freely given, so it is only fair that you should have some answers to the questions of importance to you. This article lays out the dimensions explored by the experiment and lists the metrics so that you can choose which comparisons you would like to test.
The authors wish to acknowledge the contributions made by everyone who took the time to carefully respond to the survey in good faith, believing that some good may come of it. We would like to acknowledge the efforts made by the staff and students at Liverpool, Royal Holloway, Manchester, Aberdeen, Heriot Watt, Cardiff, Imperial College and Leeds and a number of companies and organisations who allowed their internally sourced results to be published, including the PESGB. We would particularly like to acknowledge the patience and guidance given by Steven Bloemendaal, Marc Bond, Allan Scardina, Simon Neal, Paul Cleverly, Graeme Bagley, Peter Burgess and Frank Glass.
INTRODUCTION
An experiment was launched in 2017 to establish if “stacking knowledge” can support decision making in the oil & gas sector [1]. The technique involves attempting to collapse the noise created by random error, by crowd-sourcing knowledge and stacking its value components to establish a relative view of collective opinion [2]. Volunteer assessors were invited to role-play as an "exploration new venture manager" tasked with making an investment decision on a frontier exploration opportunity from a simulated environment. Just as with all data rooms, crucial information was not available in some domains and repeated in others, with little time to form an opinion. Each assessor was then independently presented with a questionnaire featuring multiple choice answers, some of which were keyed with distractors, others were graded and Gaussian. Few assessors if any have the knowledge or experience to cover all aspects of the opportunity, forcing them either to guess some metrics or to attempt rapid deductive reasoning, possibly tapping into unconscious knowledge or leveraging past experiences.
Click Crystals to run the simulation:
The questions group in to four categories:
Demographics (what is your professional experience?) – 4 questions
- Discipline; Professional role; Experience; Perspective
Overall gut-feeling (what do you think of this opportunity?) – 3 questions
- Gut-feeling; PoS; “Would you put your money on this prospect”
Geo-technical Assessment (how robust is the petroleum system?) – 10 questions
- (See radar plot below) + “which is the greatest geo-technical risk”
Geo-commercial assessment (can you make any money out of the opportunity without hurting anyone or damaging the environment?) – 7 questions
- (See radar plot below) + “which is the greatest geo-commercial risk”
The geo-technical and geo-commercial metrics are represented in the radar plot below showing “bland” overall aggregate averages*:

CHALLENGE
The “Perceptual Range” plot below looks a bit busy but simply plots individual scores on geo-commercial versus geo-technical axes on a relative scale of optimism, subjectively class-limited in to the following six categories: critical, cautious, neutral, opportunistic, bullish and reckless. Note that the distinction between classes is notional as the points are calculated as a continuum. The location of the bubbles is plotted by calculating the total geo-technical and geo-commercial scores aggregated from evidence-based metrics, with geo-technical priority below the medial line and geo-commercial priority above it. The colour of each bubble is determined by level of experience and the colour of the “halos” by the respondents’ gut-feeling for the opportunity. The graph shows the total population of assessors (471) at the time of writing.
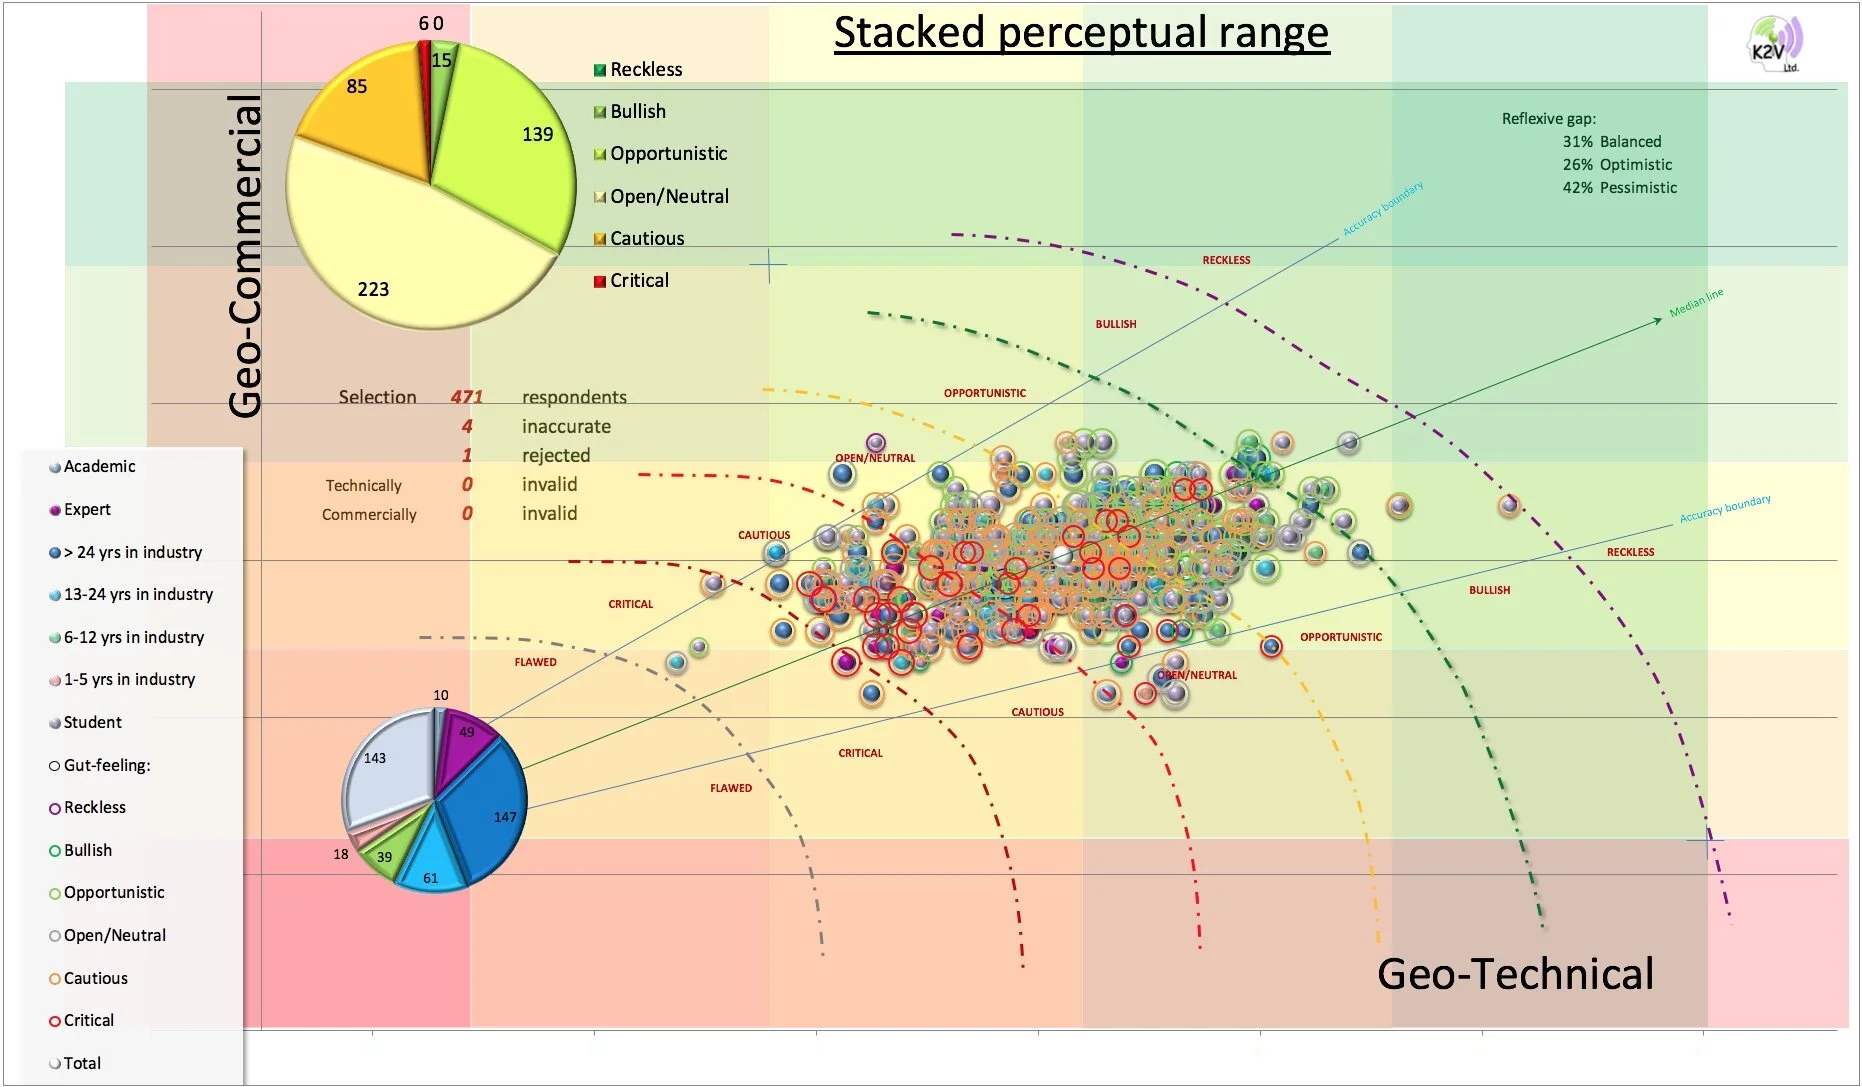
The plot shows a Gaussian distribution of assessments, with just under half (47%) scoring as open or neutral, with a third plotting as opportunistic or bullish (33%) and the remaining 20% more cautious or critical. These plots can be redrawn or filtered in any number of ways, for instance to show variations in the distribution between different experience ranges or different professional disciplines. Individual metrics can also be tested, for example, to examine if there is a relationship between the assessment of Possibility of (geological) Success (PoSg) and years of experience. Or you might want to test if those who considered reservoir quality to be the greatest risk would actually have put their money on the opportunity. The data can be displayed to highlight general insights or be tailored to specific concerns (e.g. systematic pre-drill / post-drill errors). If you would like to follow-up, please request specific analyses which might interest you. If you look long and hard enough at any data, you will always find something to confirm your greatest hopes or your worst fears, so be selective.
The aggregated total (white bubble) is in the middle of the cloud where you would expect it to be but where is the truth? Can we even expect to gain any meaningful insights from crowd-sourced opinion?
Click HERE if you want to contribute your opinion to the survey OR email info@k2vltd.com if you have an comparison you would like to test OR pass this on to a colleague OR simply post a comment below. If you like, your opinion can be compared (confidentially) with your preferred peer group, which is always interesting – surprising perhaps.
The simulation makes a lot more sense if you are a geoscientist but the scores are a lot more interesting if you aren't.
*some metrics are missing from the total assessment e.g. Running room – they were “givens” in the simulation to reduce the overall number of questions demanded of assessors.
REFERENCES:
[1] Knowledge Stacking: a crowd in search of the truth[www.k2vltd.com/article-6]
[2] On the experiment to COLLAPSE COGNITIVE BIAS (in support of decision making in the oil & gas sector)[www.k2vltd.com/article-22]